Sponsored By:

Today’s Summary
Thursday, May 28th, 2020
Indices: US Stocks closed lower in today’s session with the Dow Jones falling 148 points or 0.58%. The S&P 500 and Nasdaq fell 0.21% and 0.46%, respectively. Small-Caps underperformed significantly with the Russell 2000 dropping 2.48%.
Sectors: Utilities led, gaining 2.95%. Energy lagged, falling 2.80%.
Commodities: The July Crude Oil futures contract rose 2.74% to $33.71 per barrel. Gold futures moved higher by 1.03% to $1,728 per ounce.
Currencies: The US Dollar Index fell 0.49%.
Interest Rates: The US 10-year Treasury yield was unchanged at 0.695%.
Here are the best charts, articles, and ideas being shared on the web today!
Chart of the Day
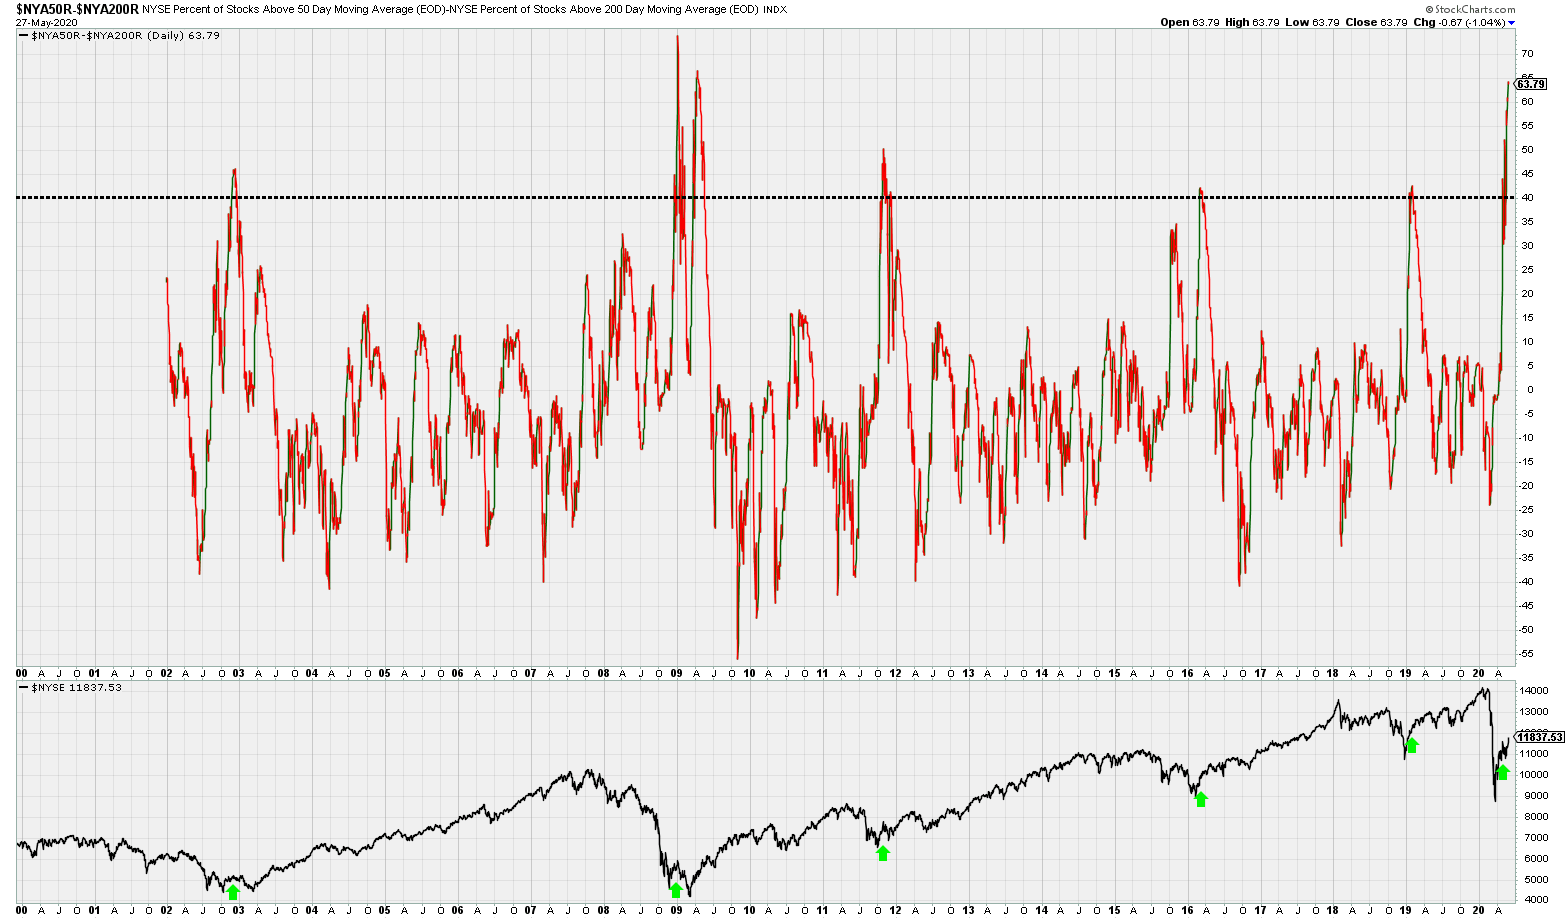
Today’s Chart of the Day was shared by Andrew Adams (@DayTraderGator). The chart shows the spread between the % of NYSE stocks above their 50-day moving average, and the % of NYSE stocks above their 200-day moving average ($NYA50R-$NYA200R). 91.57% of NYSE stocks are above their 50-day moving average, while only 27.78% are above their longer-term 200-day moving average. Andrew points out that the spread between these two breadth metrics hasn’t been this wide since 2009. The lower pane shows the NYSE over the past two decades with green arrows marking the instances where the spread spiked above 40. As you can see, this wide disparity isn’t exactly a bearish characteristic. If anything, it’s typically associated with major lows.
Quote of the Day
“The only true wisdom is knowing you know nothing.”
– Socrates (Philosopher)
Top Links
Is This Real Rotation Into Laggards? – All Star Charts
JC Parets explains that two beaten-down areas of the market, Regional Banks ($KRE) and Industrials ($XLI), appear to be bottoming on a relative basis.
Recent Rally a Sign of Strength or Just A Reaction to Weakness? – Baird
In this research note from Baird, Willie Delwiche evaluates the current market environment.
Small Caps Struggle But Breadth is Bullish – The Final Bar
In this episode of The Final Bar, David Keller and Ryan Detrick discuss market internals.
Tech Indicator Suggesting a Historic Top Could Be Forming? – Kimble Charting Solutions
Chris Kimble points out that large-cap tech (Nasdaq 100) is breaking down relative to the broader tech market (Nasdaq composite).
How is Market Breadth? – Jotting on Charts
Grant Hawkridge shares his thoughts on several important risk ratios.
Top 10 Tweets
$SPX At -0.21%, it was one of the smallest moves since we’ve seen recently, but definitely not one of the cleanest…
— Frank Cappelleri (@FrankCappelleri) May 28, 2020
S&P 500 Futures 1D
Up and out of the lake!$SPY $SPX $ES pic.twitter.com/30p6UPUoLe
— Shane C. Murphy (@murphycharts) May 28, 2020
Very few reasons to be bearish, if you're looking at charts. Has been the case since early April. Yes, there are reasons to be bearish on the economy, but its getting better. If you don't know by now that the market and the economy have diverged, you're not paying attention. $SPX pic.twitter.com/4nsNNzs31F
— Jim Denholm, CMT (@denholm_jim) May 28, 2020
Regarding my earlier comment on secular bull markets. This chart of the $SPX back to 1929 shows 3 secular bear markets each being 10-years in length. They were then followed by secular bull markets, each 20-years in length. We're still rolling in the current one… pic.twitter.com/XHdceneqZF
— The Chartist (@thechartist) May 28, 2020
Value Line Geometric Index still 25% off its highs which were hit in…..2018! pic.twitter.com/WKopZztS8G
— Dan Russo, CMT (@DanRusso_CMT) May 28, 2020
Short interest on $SPX components up 4.2% in report ending mid May.. Total short interest up 11.6% since end of February, with SPX now above Feb close. More and more shorts in the red. pic.twitter.com/9TqxqH9UCY
— Todd Salamone (@toddsalamone) May 28, 2020
A Harbinger to higher yields? Banks have started to outperform Utes which has been a historic "tell" regarding the direction of rates. pic.twitter.com/ggEGRczgjX
— RenMac: Renaissance Macro Research (@RenMacLLC) May 28, 2020
$TLT What implications does this potentially have for the equities market if we break down here? Question I'm pondering today. pic.twitter.com/fL2Rw3H0QI
— Sam McCallum (@honeystocks1) May 28, 2020
Inverse correlation between stocks and dollar strengthening over the last 2 months. Relationship now at its strongest since August of last year? pic.twitter.com/45SP33Lgnr
— Kriti Gupta (@KritiGuptaNews) May 28, 2020
$UNH UnitedHealth Group …A push above ~$304 would be a tailwind for the $DJIA, as this is the #1 weighted stock in the index. pic.twitter.com/Zr6iv9leLs
— Ian McMillan, CMT (@the_chart_life) May 28, 2020