The Rally That Won’t Quit 📈 The Chart Report

Chart of the Day
🏆 Today's Chart of the Day was shared by Randy Dunham.
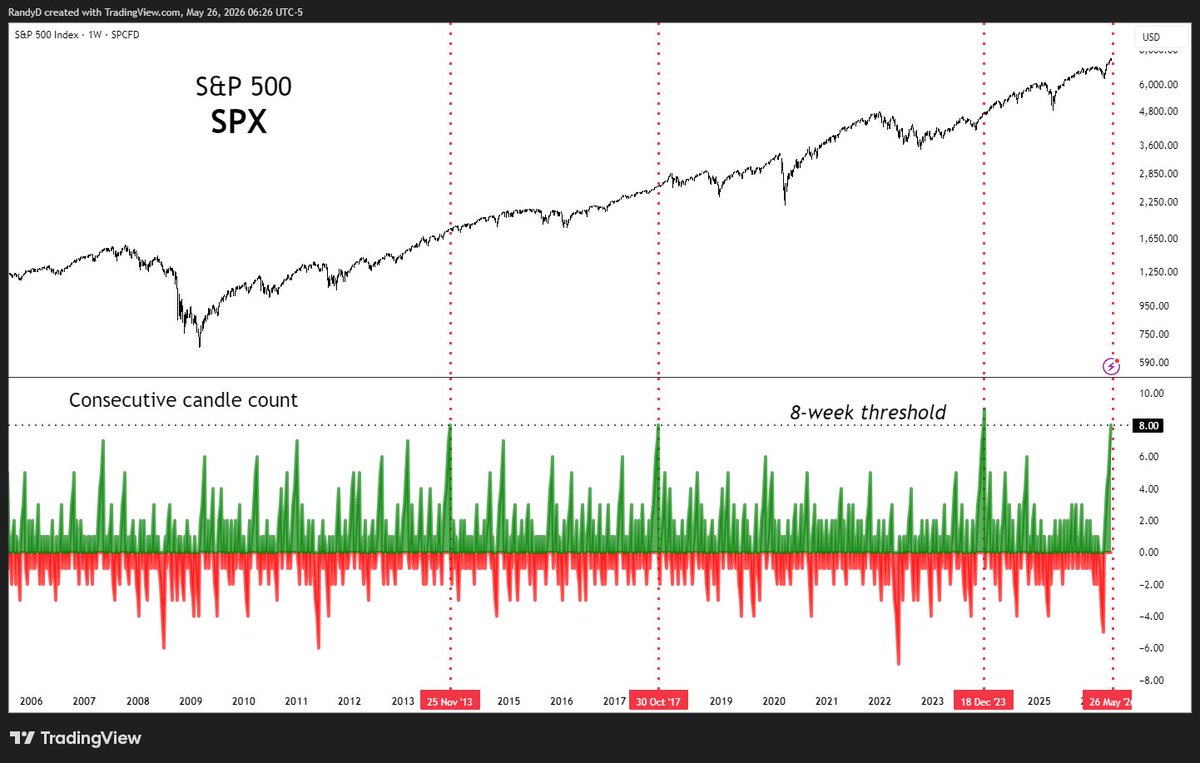
Last week, the S&P 500 recorded its eighth consecutive weekly gain, just the fourth time this has happened in the past 20 years.
This streak comes on the heels of one of the market’s longest losing stretches since the start of the decade, with five straight weeks of declines.
While things may feel extended, the median 12-month forward return following these three prior instances was +14.33%, reinforcing the idea that strength often begets more strength.
The Takeaway: The S&P 500 just posted one of its longest winning streaks in 20 years, with history pointing to stronger returns ahead.
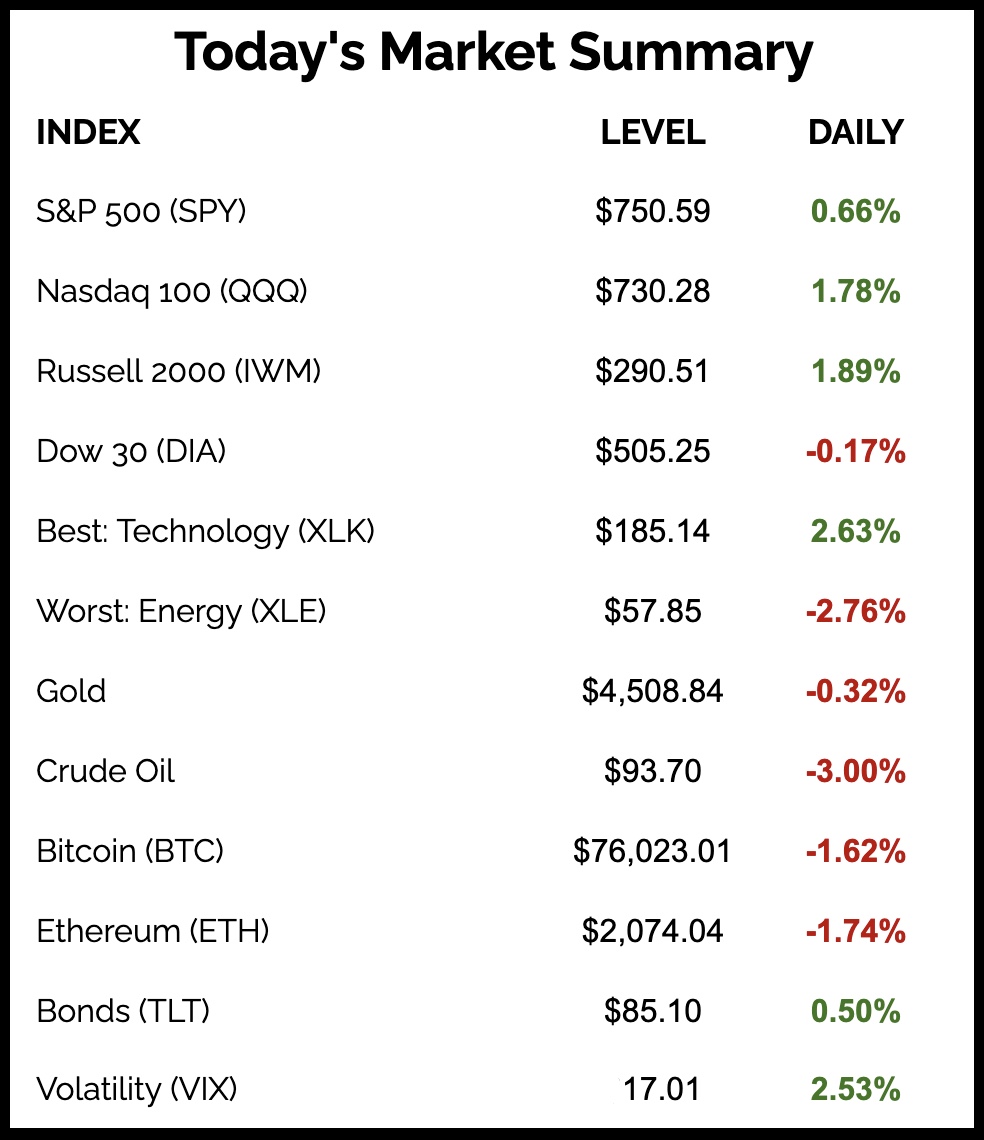
More Great Charts
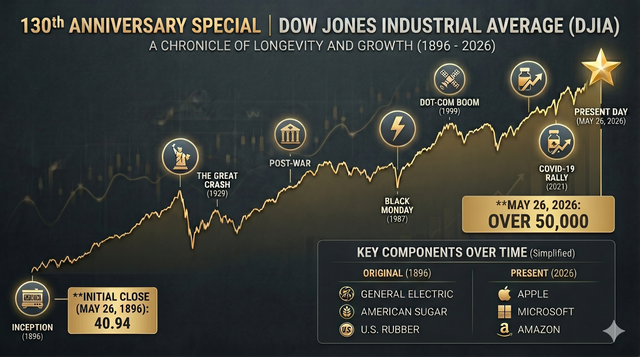
Today is the 130th anniversary of the Dow Jones Industrial Average.
Check out the full article from Max Gottlich.
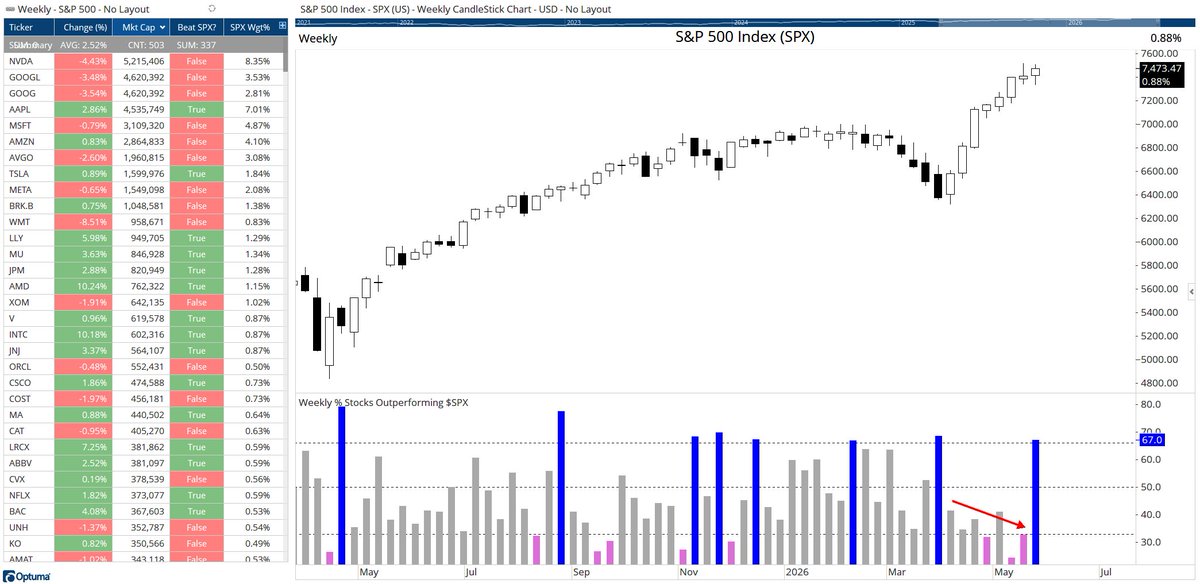
After seven weeks of narrowing leadership, roughly two-thirds of S&P 500 constituents outperformed the index last week.
View the entire tweet from Optuma.
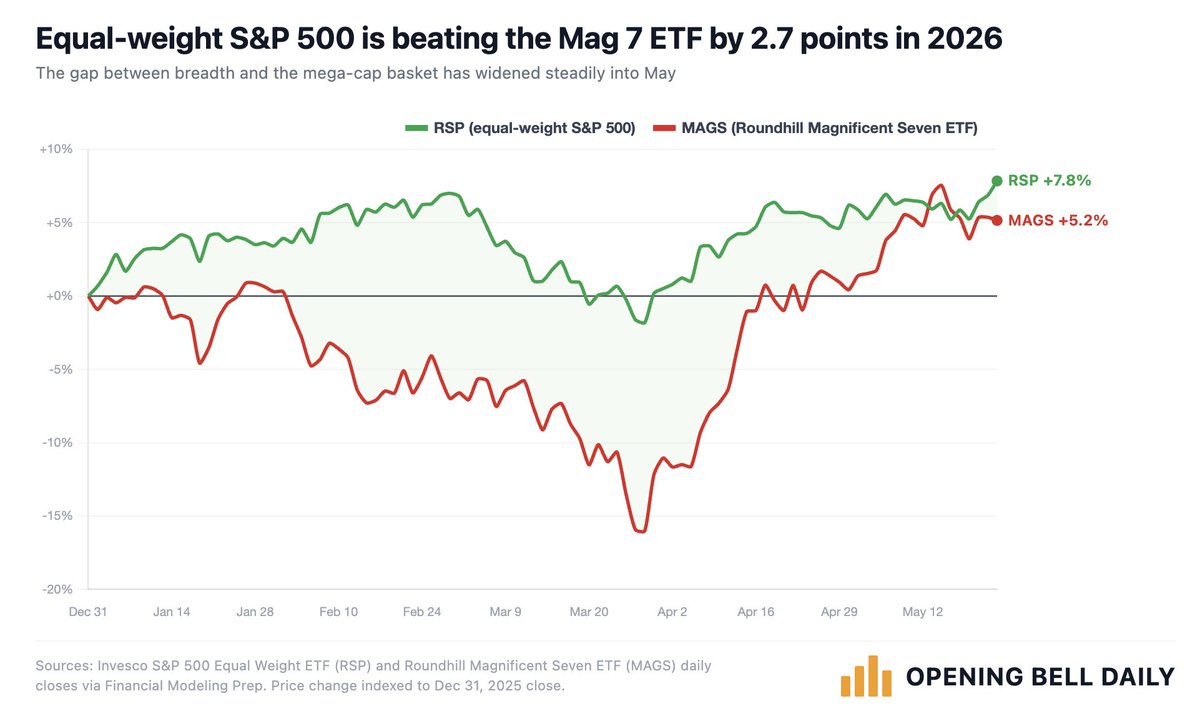
The equal weight S&P 500 is outperforming the Magnificent Seven year to date.
See the complete post from Phil Rosen.
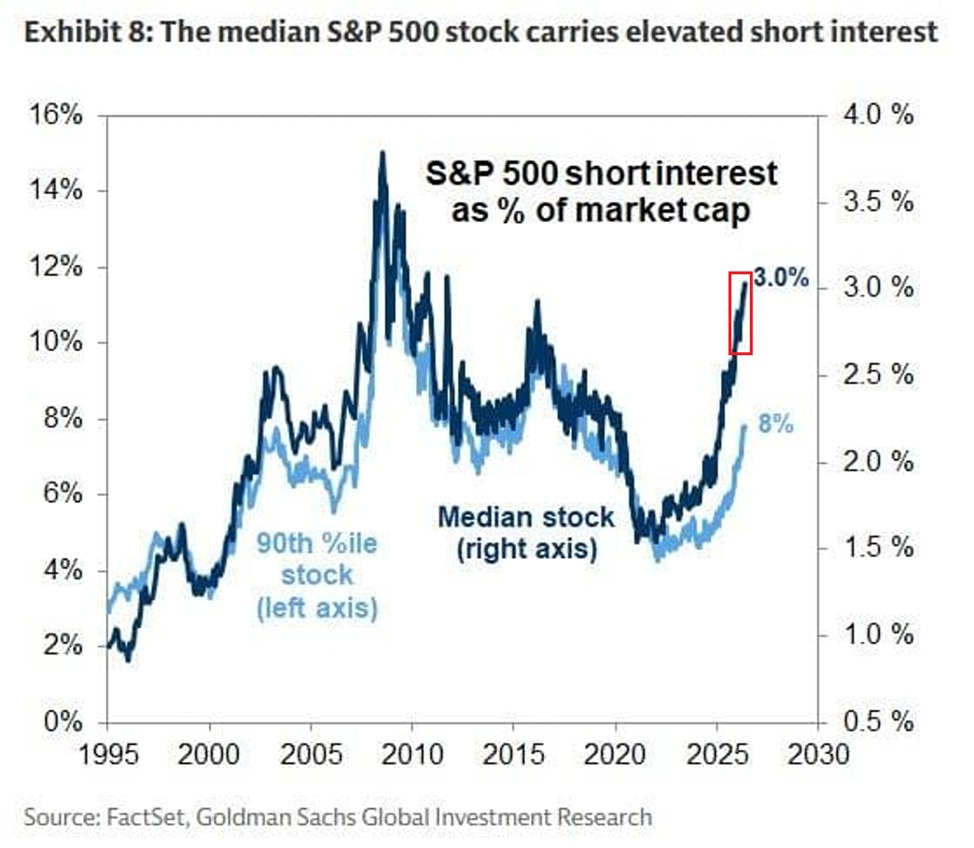
Short interest in the median S&P 500 constituent has risen to the highest level since 2012.
Examine the whole tweet from The Kobeissi Letter.
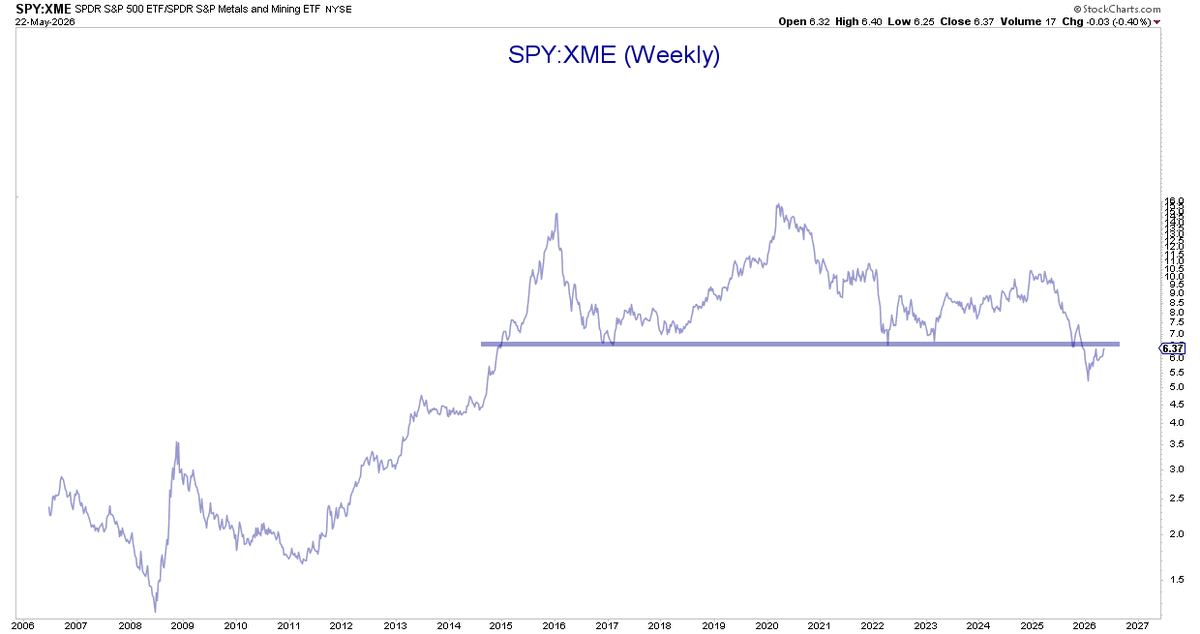
The S&P 500 relative to the Metals and Mining ETF is testing its multi-year polarity level.
View the entire post from Brian G.
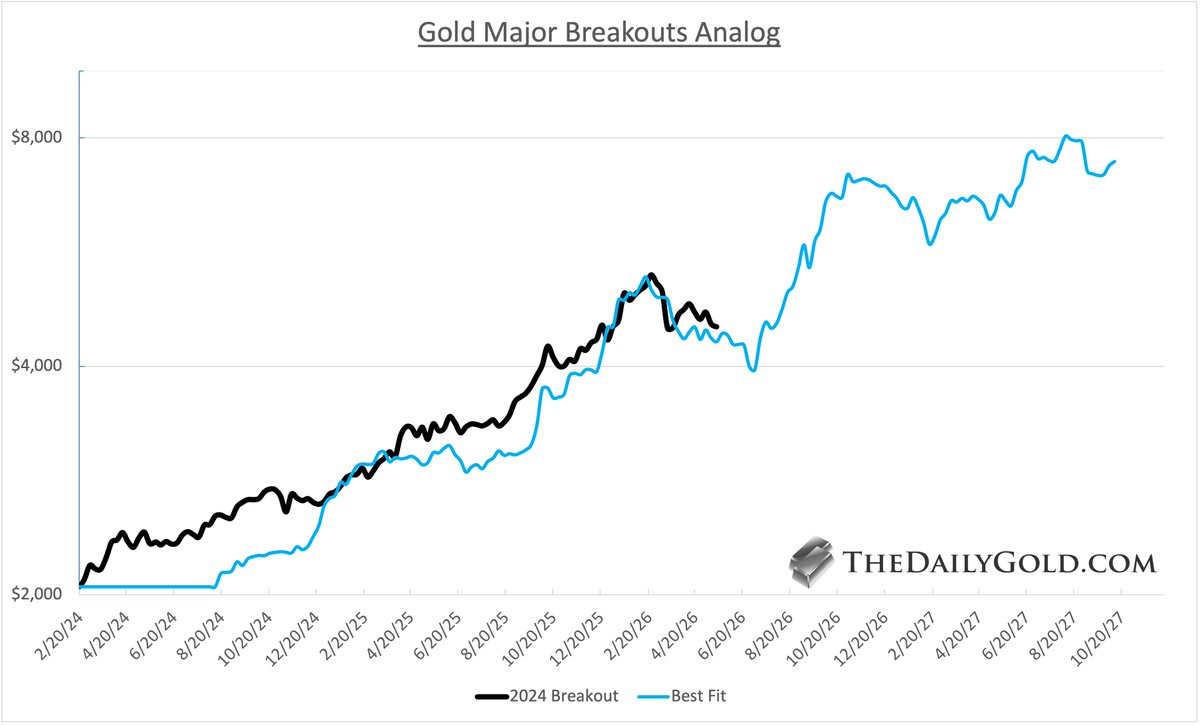
Gold is tracking closely with its historical major breakouts analog.
See the full post from Jordan Roy-Byrne.
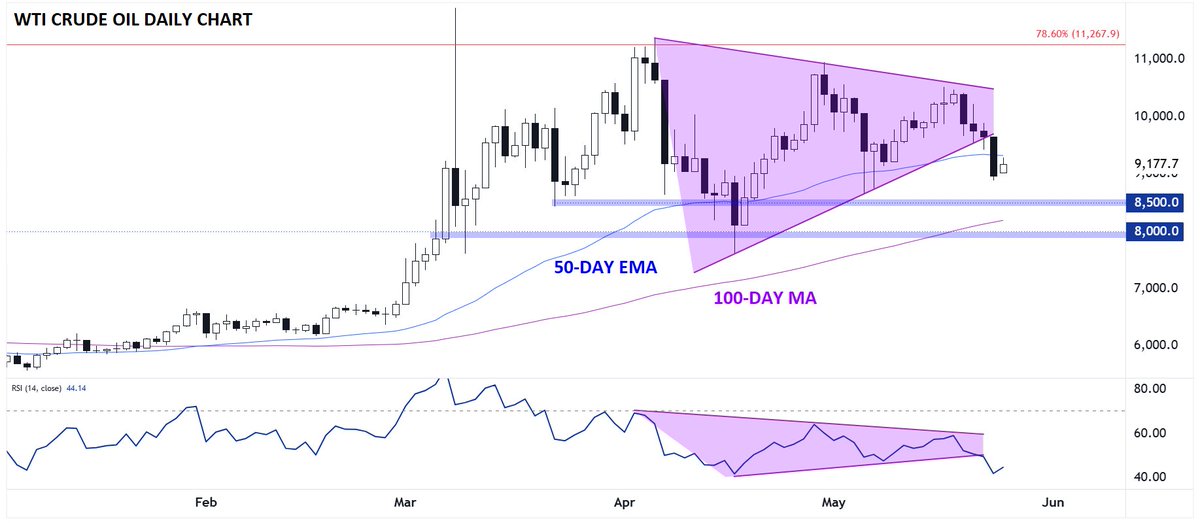
Crude oil is breaking lower out of its multi-week consolidation and has slipped below the 50-day EMA.
Read the complete analysis from whole Matt Weller.
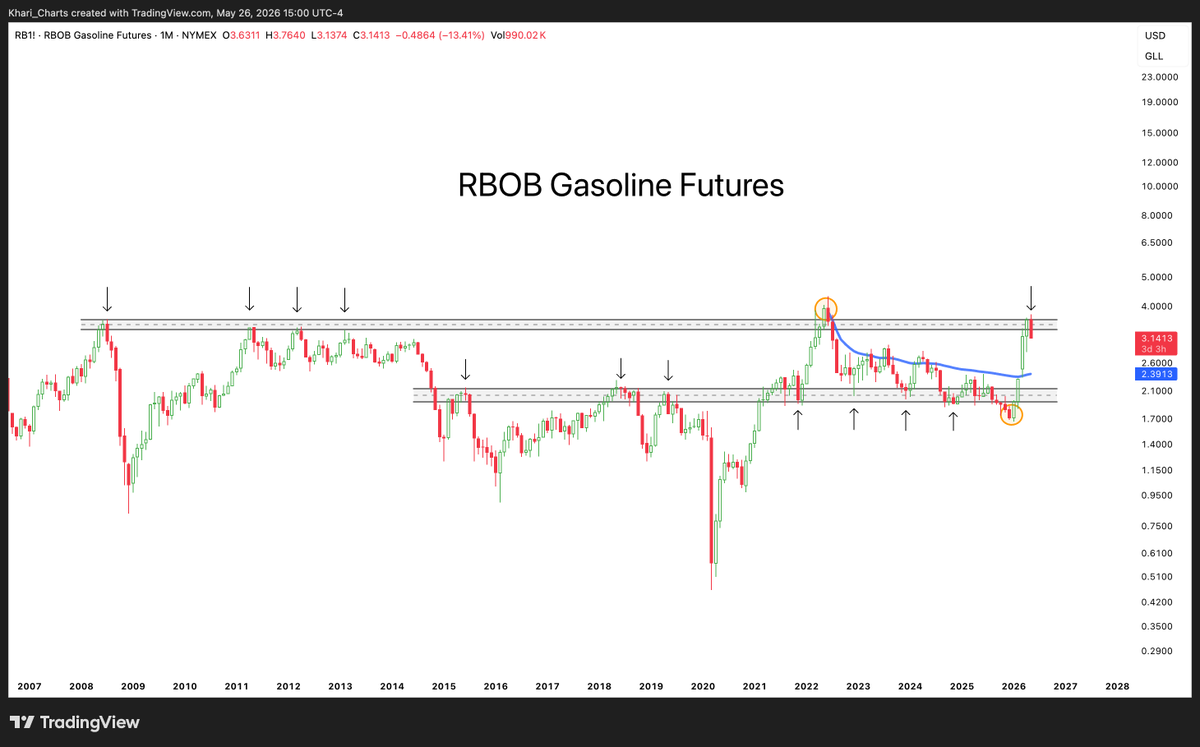
Gasoline futures are rejecting their long-term resistance level.
Examine the whole tweet from A.J. Gregor.
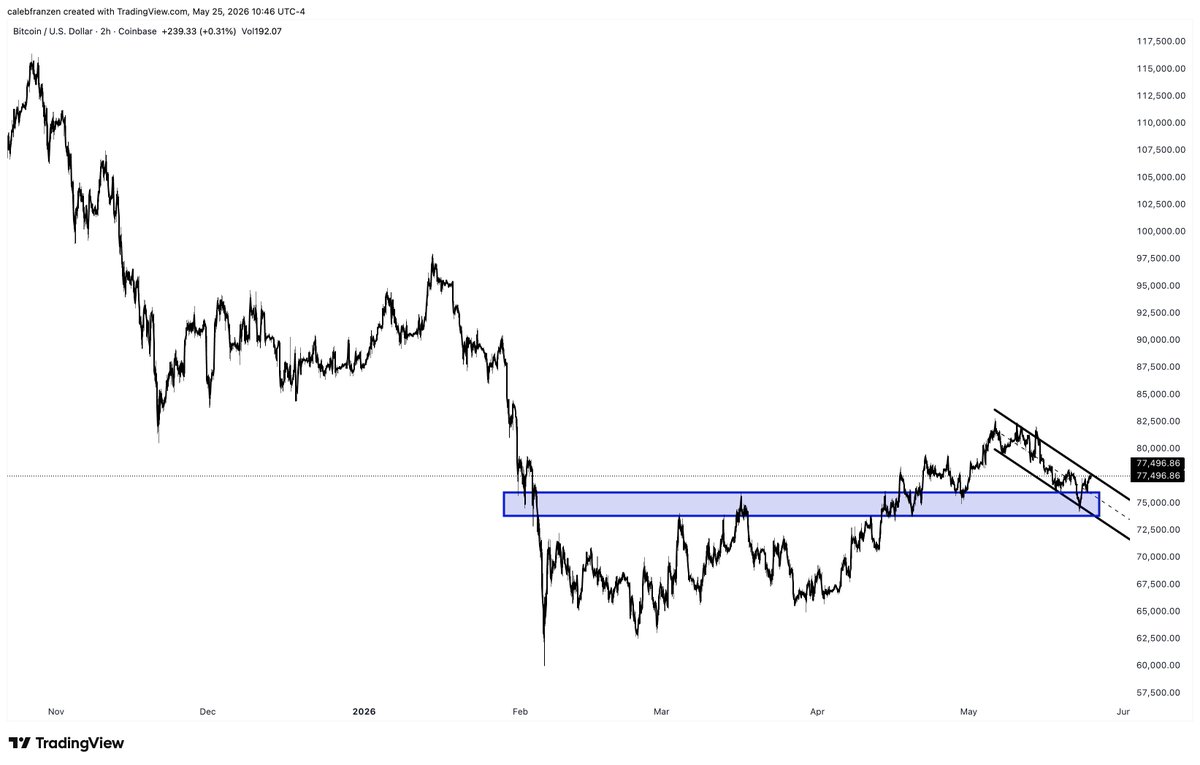
Bitcoin is retesting its prior breakout area near 75k.
Check out the entire post from Caleb Franzen.
The Chart Report curates best-in-class technical analysis from across the web.
If you’d like to share a chart or just say hello, email us at [email protected]