Intra-Sector Rotation Favors Software 📈 The Chart Report

Chart of the Day
🏆 Today's Chart of the Day was shared by Sam Gatlin.
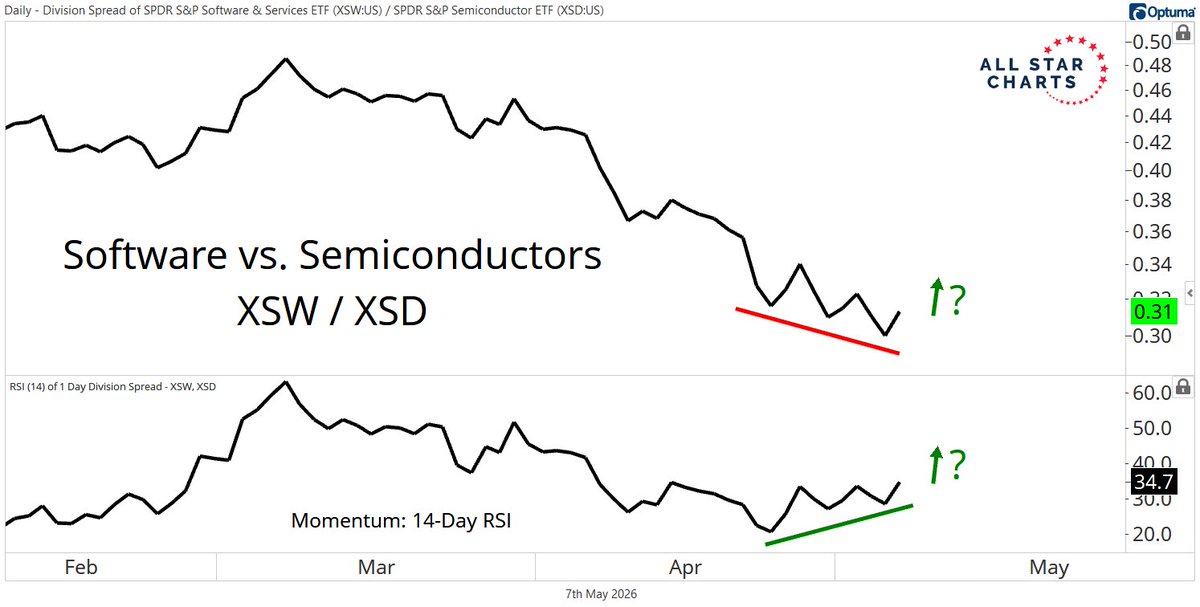
The Software ETF (IGV) broke to new 3-month highs today, as the Equal Weight Software versus Semiconductor ratio (XSW/XSD) flashes a bullish momentum divergence.
We’ve witnessed historic dispersion between the two groups, with semiconductors trading farther above their 200-day moving average relative to software than ever before on record.
From here, investors face a choice: continue to lean into the relative strength of semis or rotate into the beaten down software group in anticipation of a sustained catch-up trade.
The Takeaway: After a historic run in semiconductors, software is setting up as the next potential opportunity within Tech.
More Great Charts
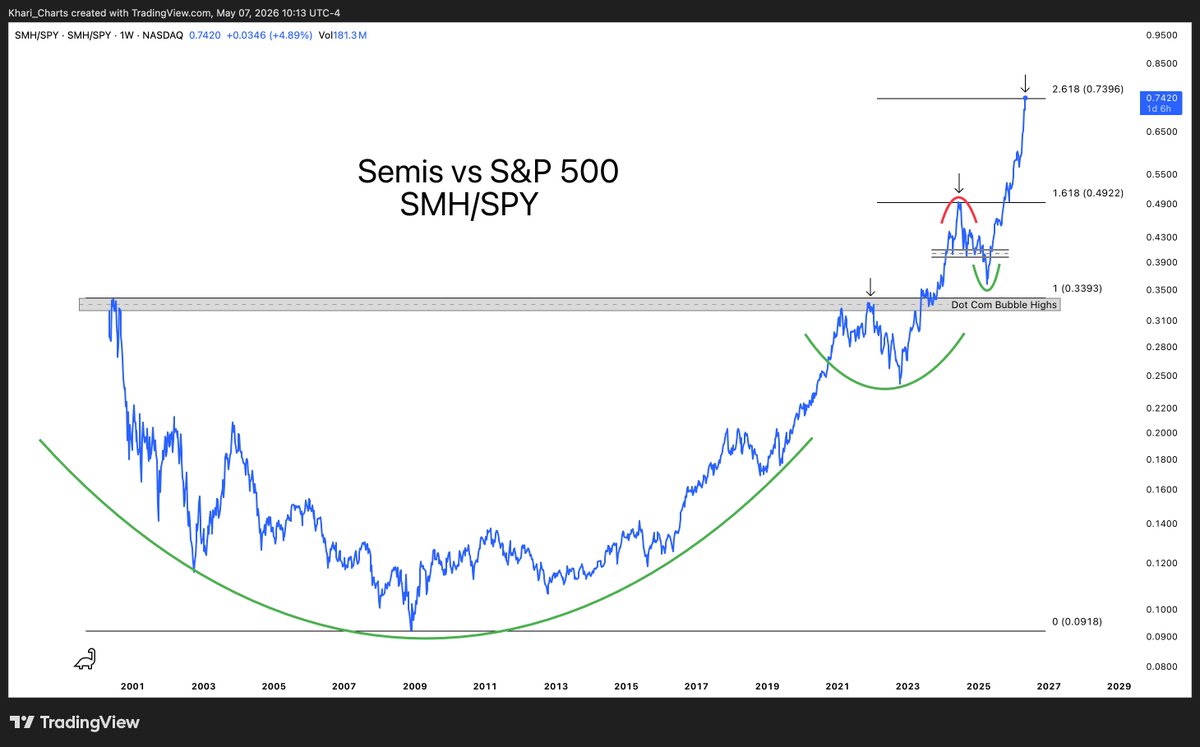
Semiconductors relative to the S&P 500 have now reached the 2.618% Fibonacci extension measured from the Dot-Com peak to the GFC low.
View the whole tweet from A.J. Gregor.
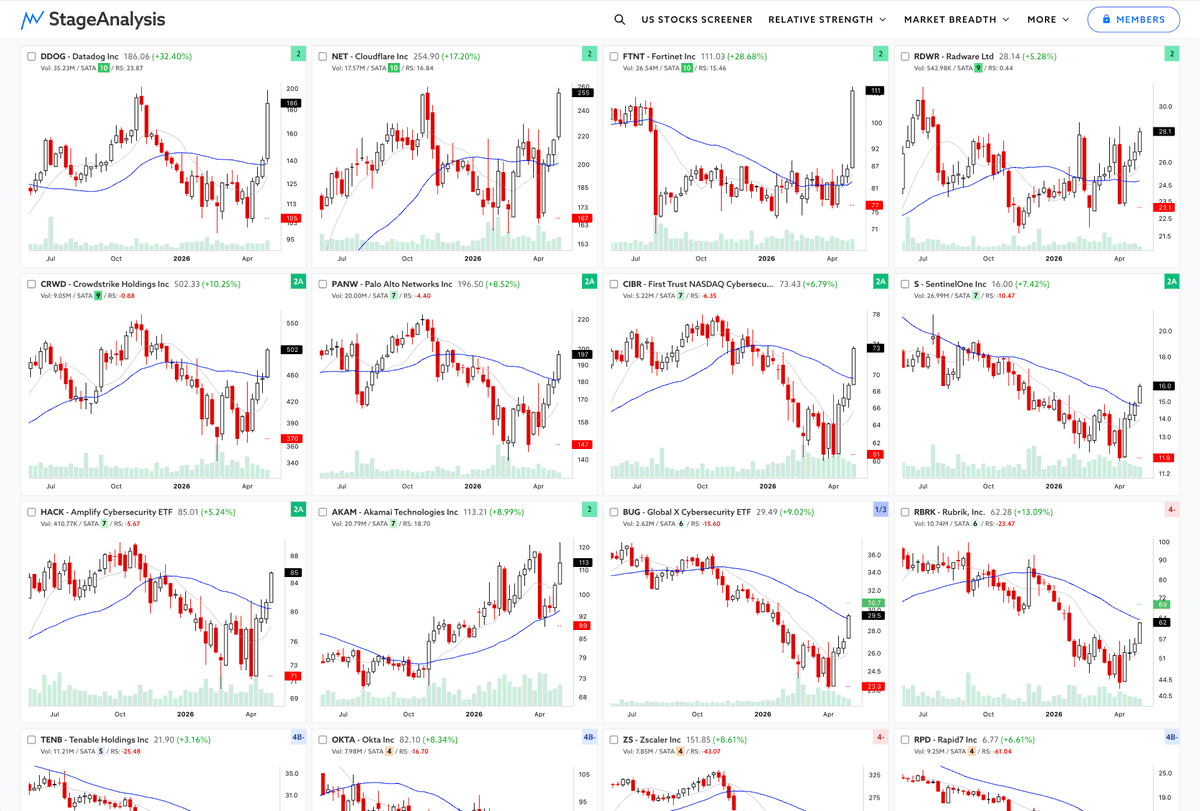
The Cybersecurity industry is seeing multiple Stage 2 breakout attempts.
See the full post from Stage Analysis.
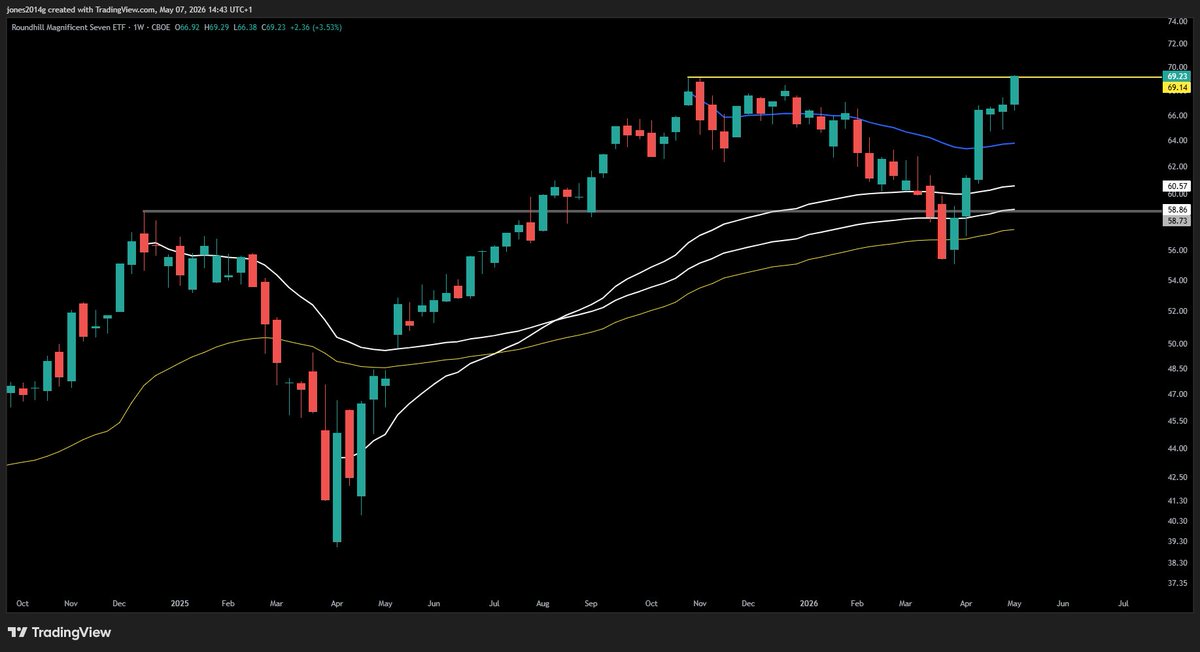
The Magnificent Seven ETF made new all-time highs today.
Examine the entire tweet from Quantdata21.
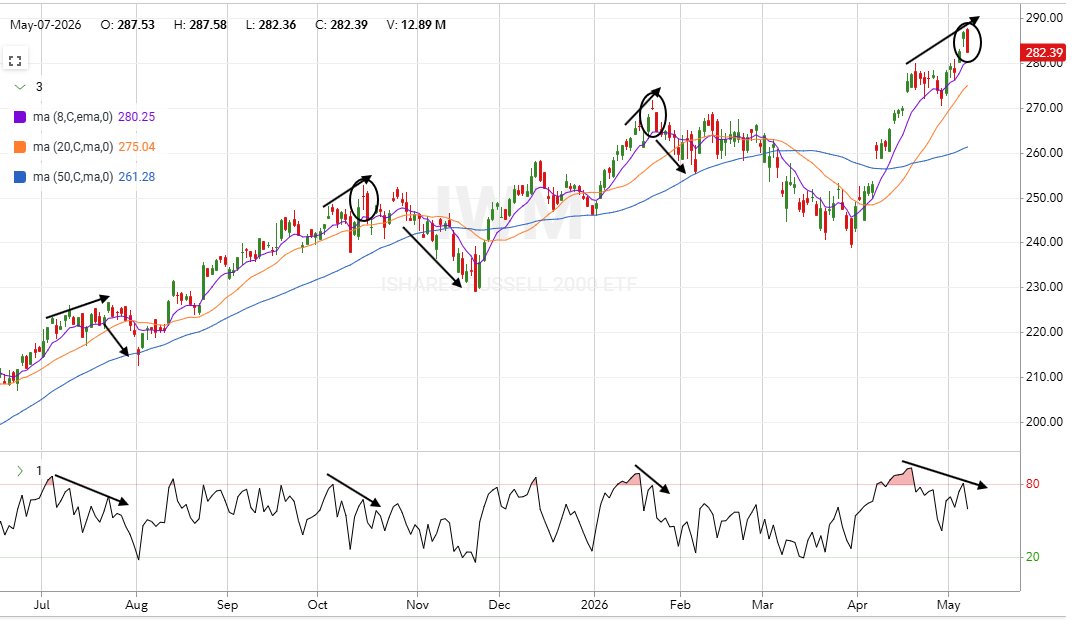
Small-caps are flashing a bearish momentum divergence (RSI 5).
Check out the complete post from Reformed Trader.
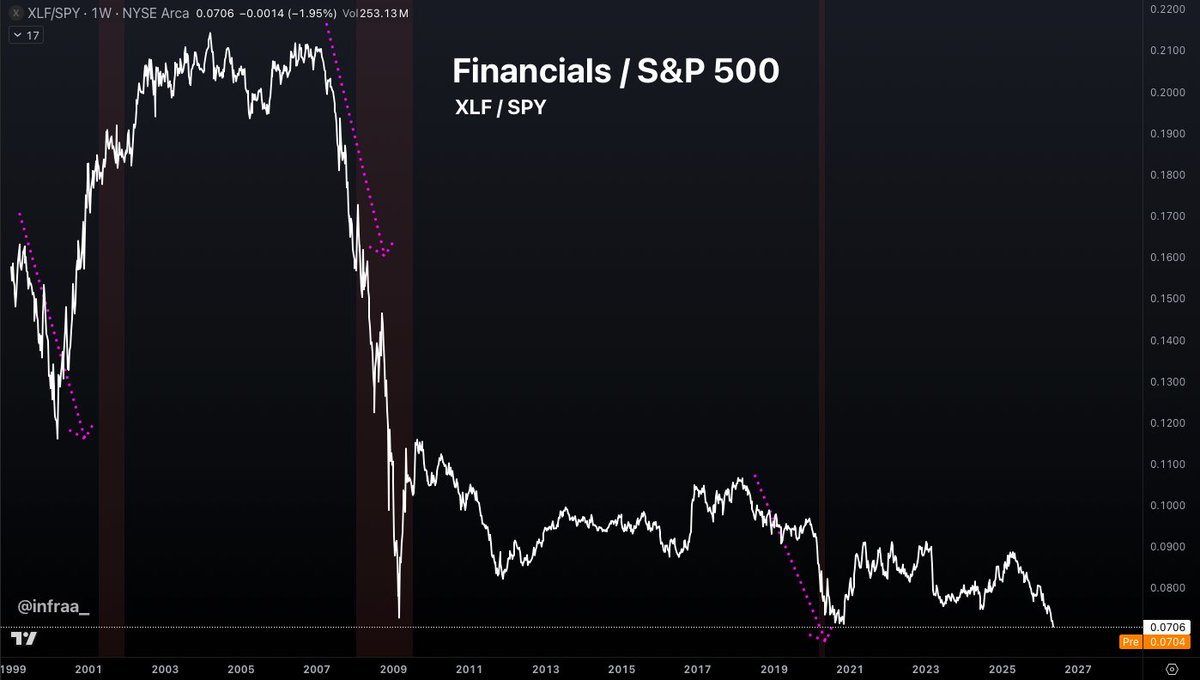
The Financial sector is making new all-time lows versus the S&P 500.
View the whole tweet from Robert.
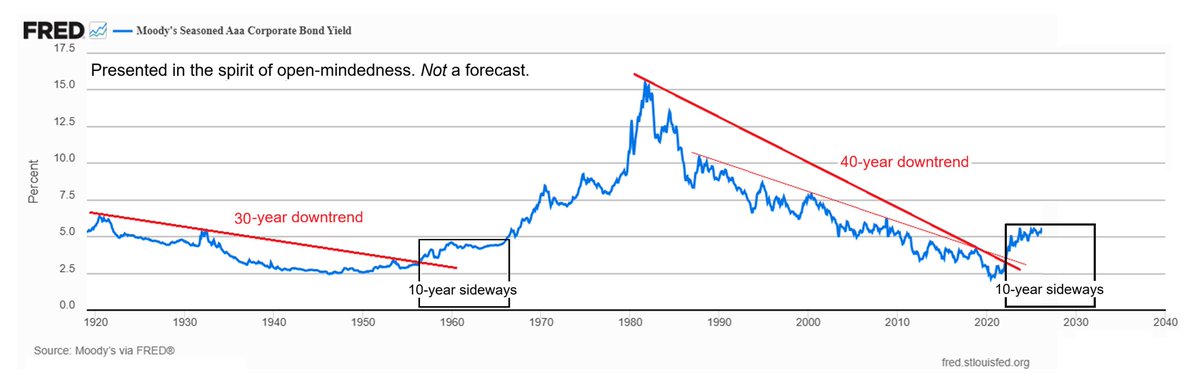
Bond yields may have ended their secular downtrend in 2022, though that doesn’t automatically mean a straight move higher from here.
A prolonged sideways range remains a realistic possibility, similar to the last instance.
See the full post from Mark Ungewitter.
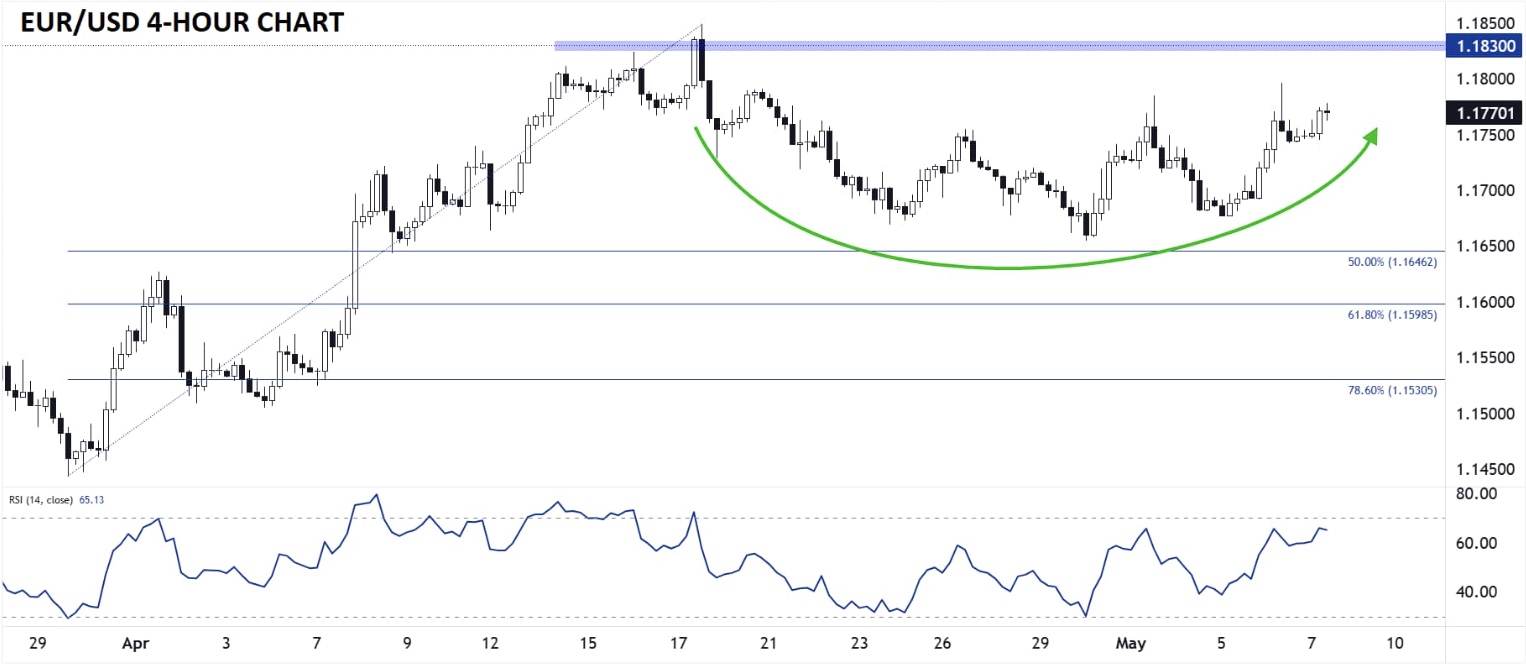
EUR/USD has shifted from a pattern of lower highs and lower lows to one of higher highs and higher lows over the past week, opening the door for a possible retest of the prior highs near 1.1830.
Read the complete analysis from Matt Weller.
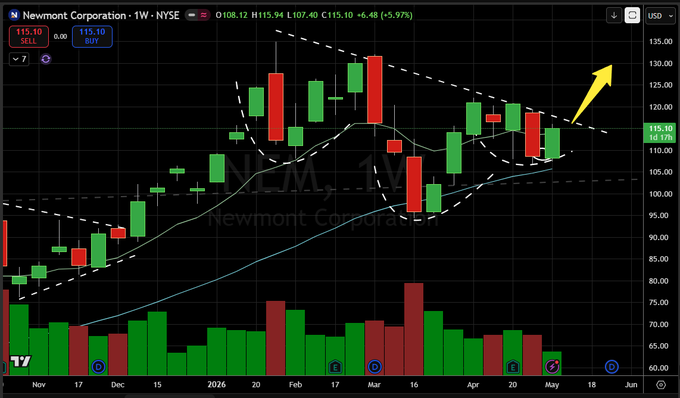
Newmont Mining, the largest gold miner, is potentially carving out an inverse head-and-shoulders pattern on the weekly timeframe.
Check out the entire tweet from Shake Pryzby.
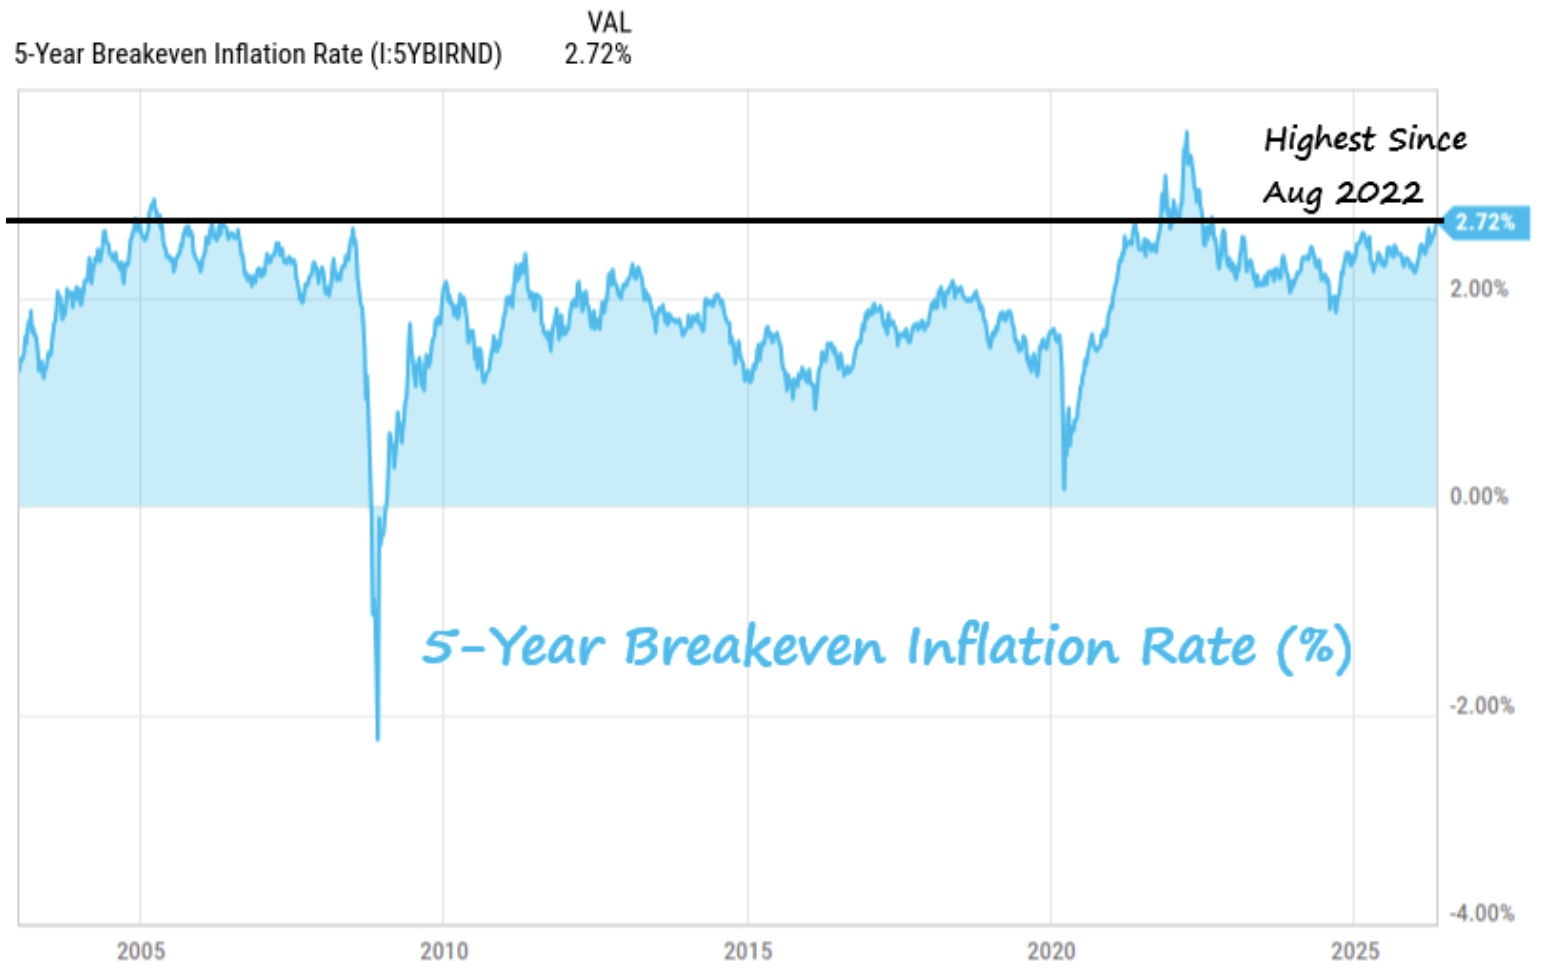
Market-implied inflation expectations have climbed to 2.72%, the highest reading since August 2022.
Read the full article from Charlie Bilello.
The Chart Report curates best-in-class technical analysis from across the web.
If you’d like to share a chart or just say hello, email us at [email protected]