Sponsored By:

Today’s Summary
Monday, May 4th, 2020
Indices: US Stocks closed higher to start the week, with the Dow Jones Industrial Average inching up 26 points or 0.11%. The Nasdaq was the clear outperformer, gaining 1.23%, while the S&P 500 rose 0.43%. The Russell 2000 moved higher by 0.28%.
Sectors: Energy led significantly, gaining 3.46%. Industrials lagged, falling 1.27%.
Commodities: The June Crude Oil futures contract jumped 7.08% to $21.18 per barrel. Gold futures moved higher by 0.58% to $1,711 per ounce.
Currencies: The US Dollar Index rose 0.45%.
Interest Rates: The US 10-year Treasury yield moved higher to 0.638%.
Here are the best charts, articles, and ideas being shared on the web today!
Chart of the Day
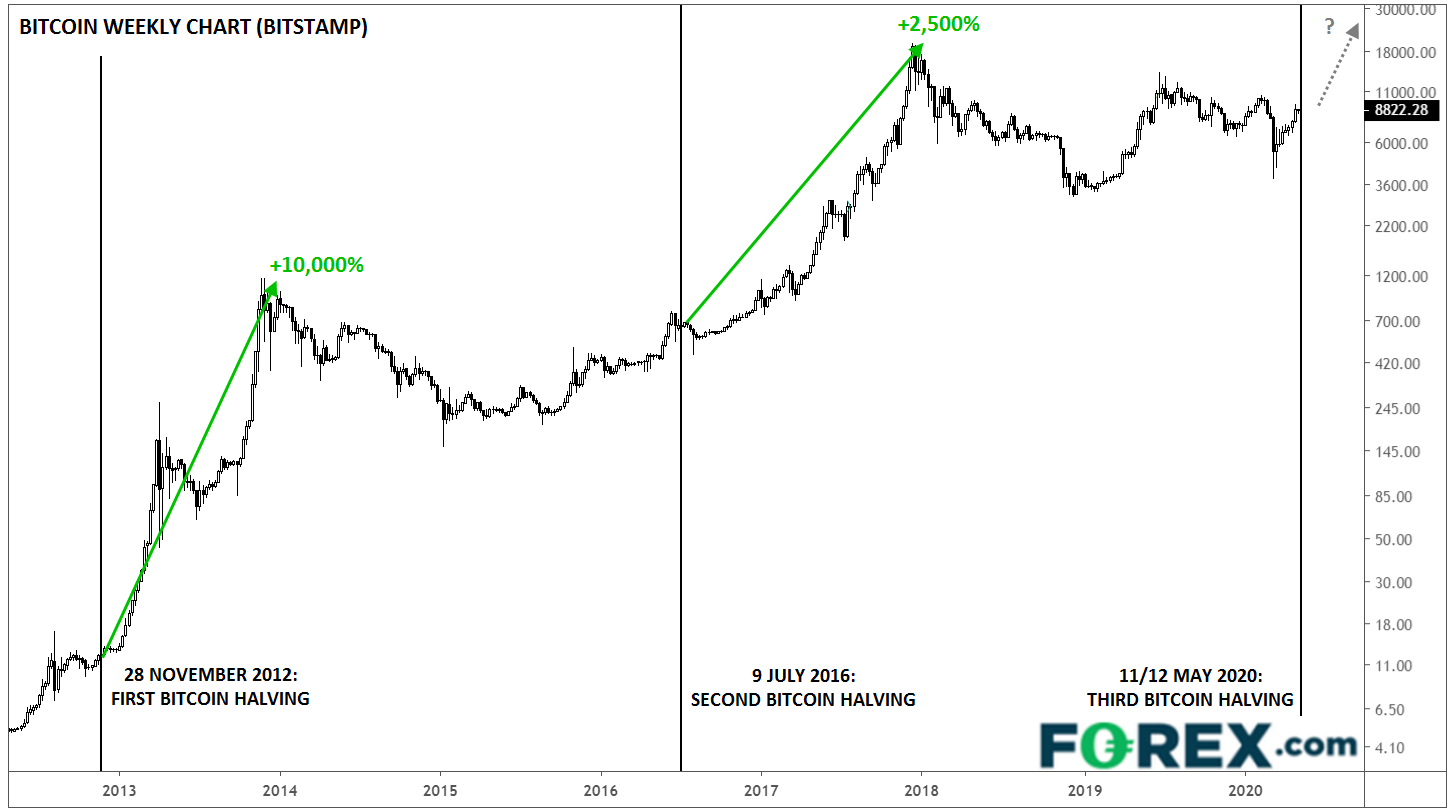
Today’s Chart of the Day was shared by Matt Weller of Forex.com, in an article titled: “The Bitcoin Halving: What Traders Need to Know.” It’s a weekly candlestick chart of Bitcoin priced in US dollars, going back to 2012. In the article, Matt discusses the third Bitcoin “halving” event that is expected to occur around May 11th or 12th. This event is programmed into bitcoin’s code to take place every four years. It essentially reduces the reward given to miners by 50% per block mined. Matt explains: “Bitcoin has thrived in the wake of its previous two halving events (though we’d be remiss not to remind readers that past performance is not necessarily indicative of future returns!). From a purely supply and demand perspective, a bullish reaction to supply cuts makes sense; after all, at current prices, the amount of newly-created bitcoin each day (which is usually sold into the market by miners) will drop from $16M to closer to $8M. In this way, it’s not surprising that the previous two bitcoin halvings kicked off huge rallies of 10,000% and 2,500%, respectively.” Click here to check out the full article.
Quote of the Day
“The greatest teacher, failure is.”
– Yoda (Star Wars)
Top Links
Weekly S&P 500 #ChartStorm – Topdown Charts
Callum Thomas shares ten insightful charts that help to make sense of the current market environment.
Have the Equity Generals Come Under Fire? – Andrew Thrasher
Andrew Thrasher takes a look at a custom index of the largest stocks in the S&P 500 and what it would mean for the broader market if these ‘Generals’ start to weaken.
The Rally Has Paused – Momentum Monday
In their weekly video, Howard Lindzon and Ivanhoff scan through dozens of charts to highlight some key themes and trends in the market.
Charts to Watch in May – All Star Charts
JC Parets lays out some of the most important charts to keep an eye on this month.
Hot & Cold – The Weekly Trend
In this podcast, David Zarling and Ian McMillan discuss recent price action and some of the latest technical developments.
Top 10 Tweets
A Tale of Two Indices. Looking only at the (cap-weighted) S&P500 and Nasdaq, you might be getting a misleading picture of performance in 2020. The equal-weighted indices trail their cap-weighted counterparts by 7-8%+. $SPX $NDX pic.twitter.com/QUtMjue575
— Michael McKerr (@MikeMcKerr_TDA) May 4, 2020
S&P 500 Index rolling over from the 61.8% Fibonacci retracement zone, driving mathematic historians wild. https://t.co/BtpnxVjGsH$SPX $SPY $ES_F pic.twitter.com/ckzN39izxx
— Equity Clock (@EquityClock) May 3, 2020
Asset class investment returns through April. #Bonds, #gold, #cash are at the top. Pretty much unchanged on the year: #tech, #healthcare and utilities. pic.twitter.com/gpZxDPG9sN
— Jurrien Timmer (@TimmerFidelity) May 4, 2020
The S&P 500 hasn't been lower during an election year with a President up for re-election going back to 1950.
Down 12% YTD of #MayTheFourth … pic.twitter.com/wHqrHdzjHY
— Ryan Detrick, CMT (@RyanDetrick) May 4, 2020
Sentiment (updated from Apr 21).
Have to stress this signal – it's too important:
Sentiment may have topped last week – note Bear market rallies topped *EXACTLY* in this region.
Stocks appear to have failed at a critical level – this is a very big problem.$NQ_F $NDX $QQQ pic.twitter.com/wQzsYVNyGg
— Macro Charts (@MacroCharts) May 4, 2020
Overhead Supply for Total World Index$VT pic.twitter.com/tsjnn0MW7v
— David Zarling (@AdaptivCharts) May 4, 2020
Two helpful tells for equities to watch. pic.twitter.com/aak43BZLh4
— Strategas (@StrategasRP) May 4, 2020
A structural weaker US dollar could be the catalyst to get risk assets higher from here, but so far this has not been the case. #USD pic.twitter.com/cqNdbm6TBV
— jeroen blokland (@jsblokland) May 4, 2020
$OVX oil vol near lowest level in 2 months – under 100% – #OVX chart https://t.co/vKcu87c77e
— Mike Zaccardi, CFA, CMT (@MikeZaccardi) May 4, 2020
Lol as if Buffett is ever going to actually tell you what he is doing. $WFC $XLV $BRK pic.twitter.com/yTXPpgQxWQ
— Arun S. Chopra CFA CMT? (@FusionptCapital) May 4, 2020