The Commodity Comeback Story 📈 The Chart Report

Chart of the Day
🏆 Today's Chart of the Day was shared by David Cox.
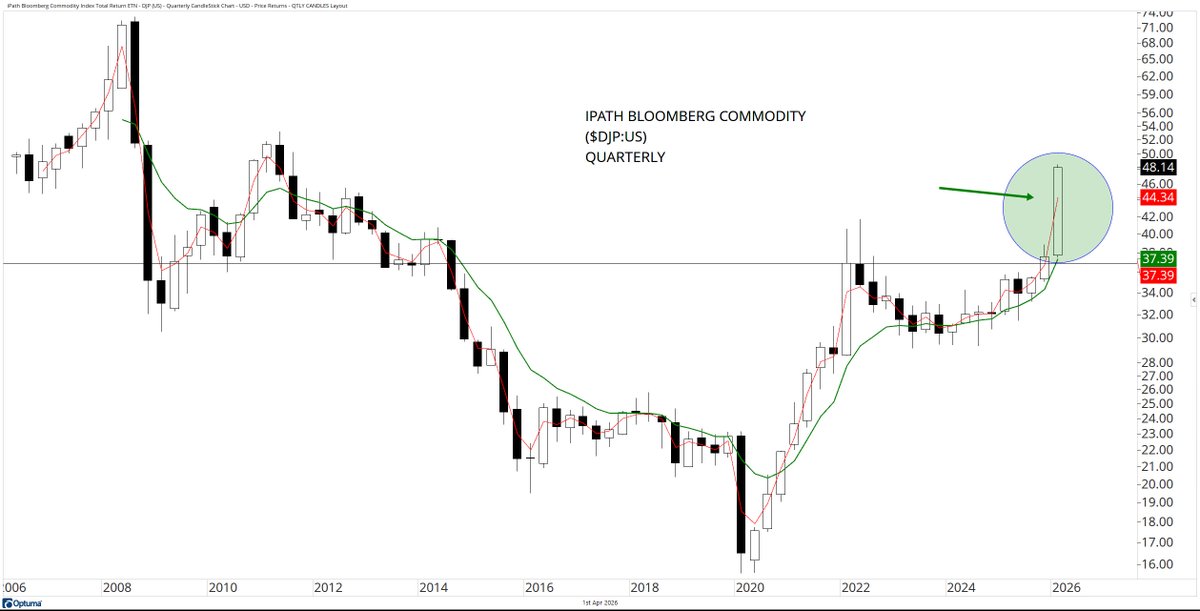
The Bloomberg Commodity Index closed Q1 with its second strongest quarterly gain on record, narrowly trailing Q1 of 2022.
The Index has been forming a multi-year cup-and-handle beneath its 2008 peak and has resolved to the upside with force.
Several commodities have started the year with historic gains, with Silver surging in January and Crude Oil following in March, highlighting the underlying strength of this commodity bull market.
The Takeaway: Commodities are off to one of their strongest starts ever, with the path of least resistance now pointing higher.
More Great Charts
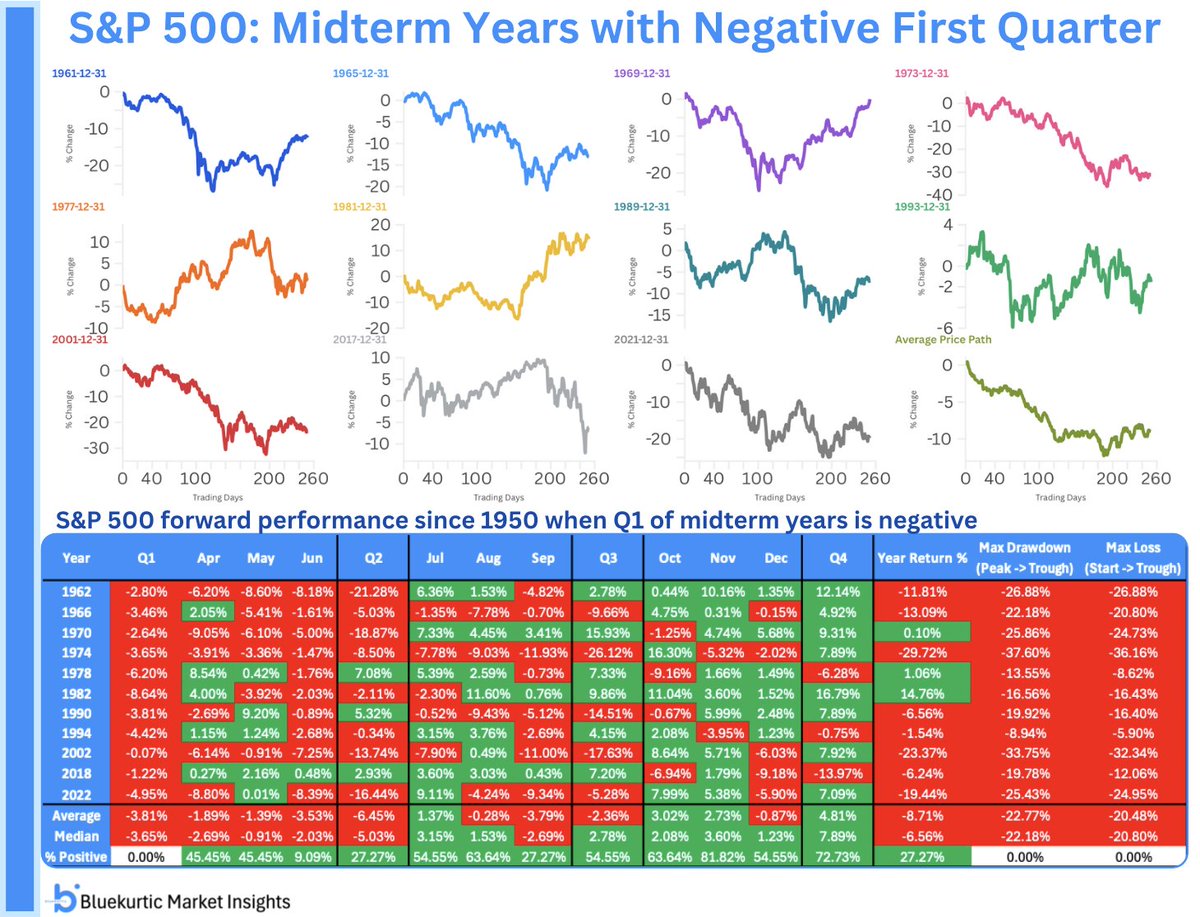
Negative first quarters during midterm years have historically led to weak full-year outcomes.
Only 3 of the past 11 instances finished positive, with an average return of -8.7%.
Check out the complete post from Bluekurtic.
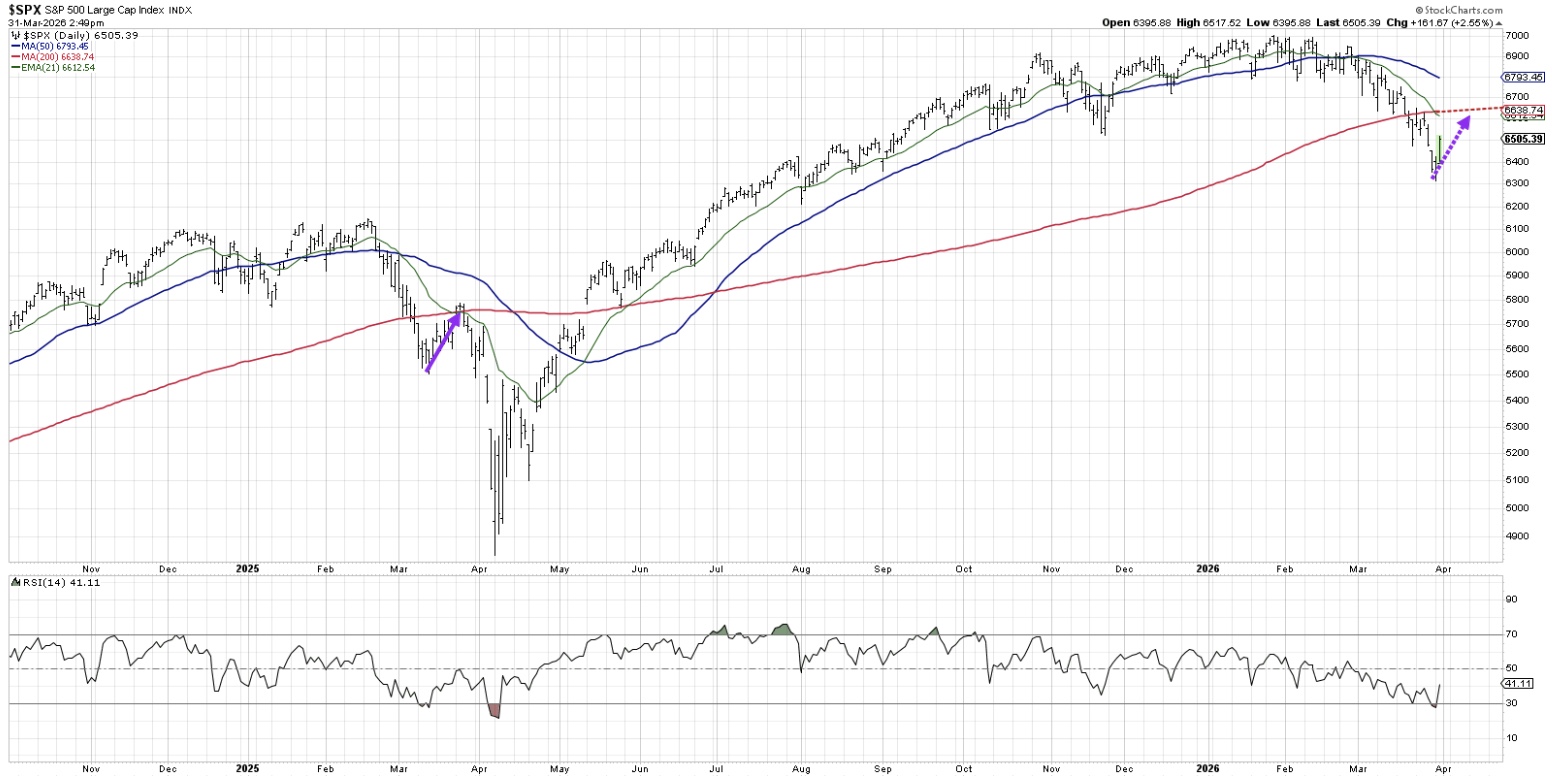
Yesterday marked the strongest upside volume day since the April 2025 lows.
See the entire tweet from Larry Tentarelli.
Some of the strongest rallies tend to occur within downtrends, as sidelined buyers chase short-term rebounds expecting a full recovery.
Early 2025 offers a clear precedent for how this dynamic can unfold.
Read the full analysis from David Keller.
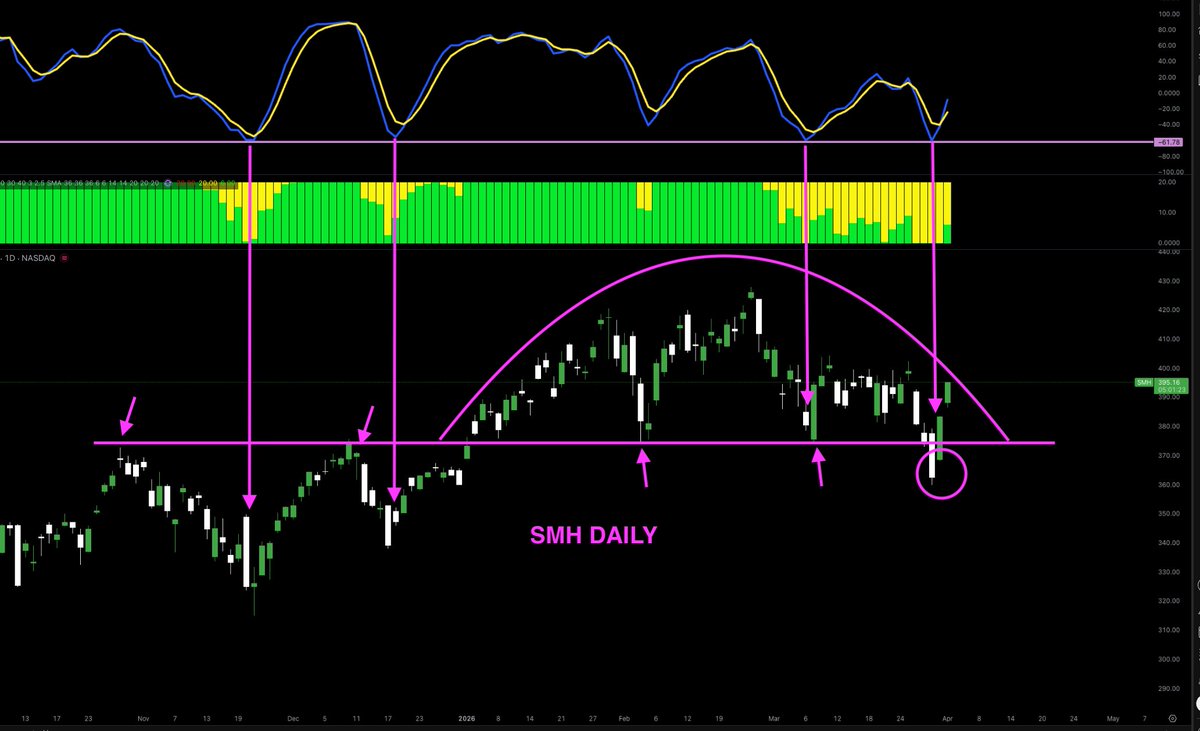
Semiconductors, arguably the market’s most critical industry group, just staged a failed breakdown and surged back above multi-month support.
View the entire tweet from Henry.
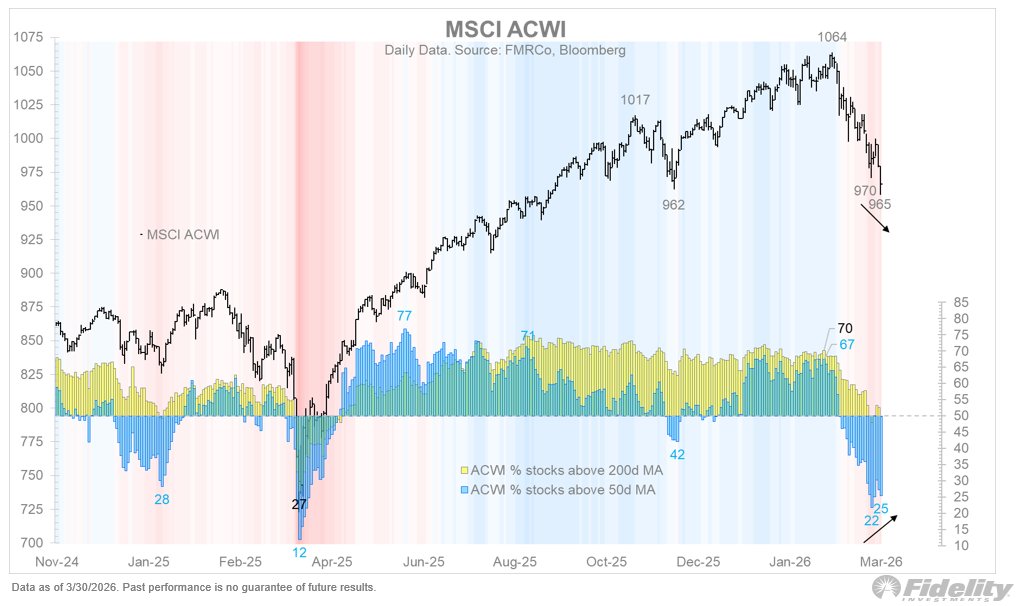
While the MSCI ACWI printed a new low, the percentage of global stocks above their 50-day moving average held a higher low.
This divergence points to the potential for a near-term trading bottom.
Explore the full article from Jurrien Timmer.
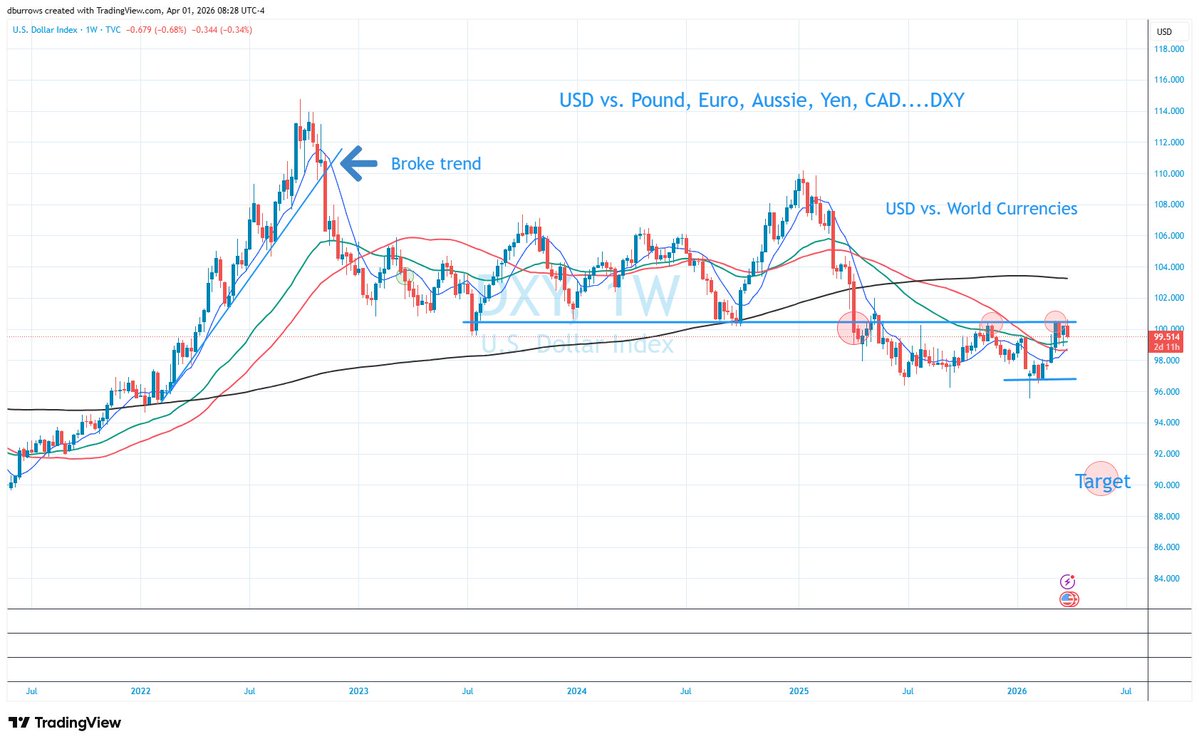
The U.S. Dollar Index continues to stall at former resistance, and a weaker dollar remains supportive of relative strength in international equities and commodities.
View the full tweet from David Burrows.
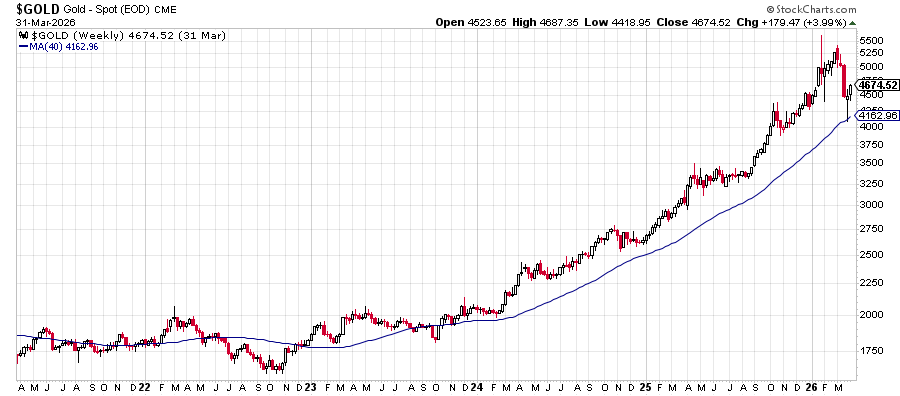
Gold is rallying after a textbook pullback to the upward sloping 40-week moving average (approximately 200-day MA).
Read the latest blog post from Ryan Detrick.
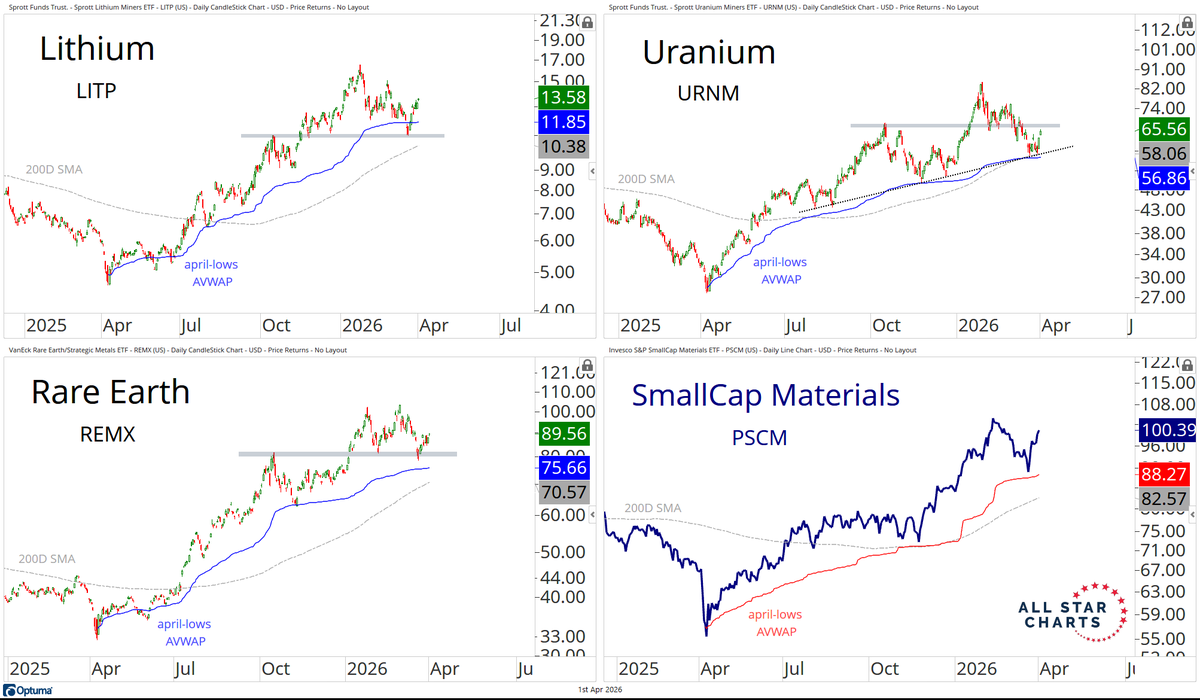
The alt-metals complex appears to be carving out a potential higher low, with small-cap Materials showing a similar setup.
Check out the entire tweet from Ricardo Sarraf.
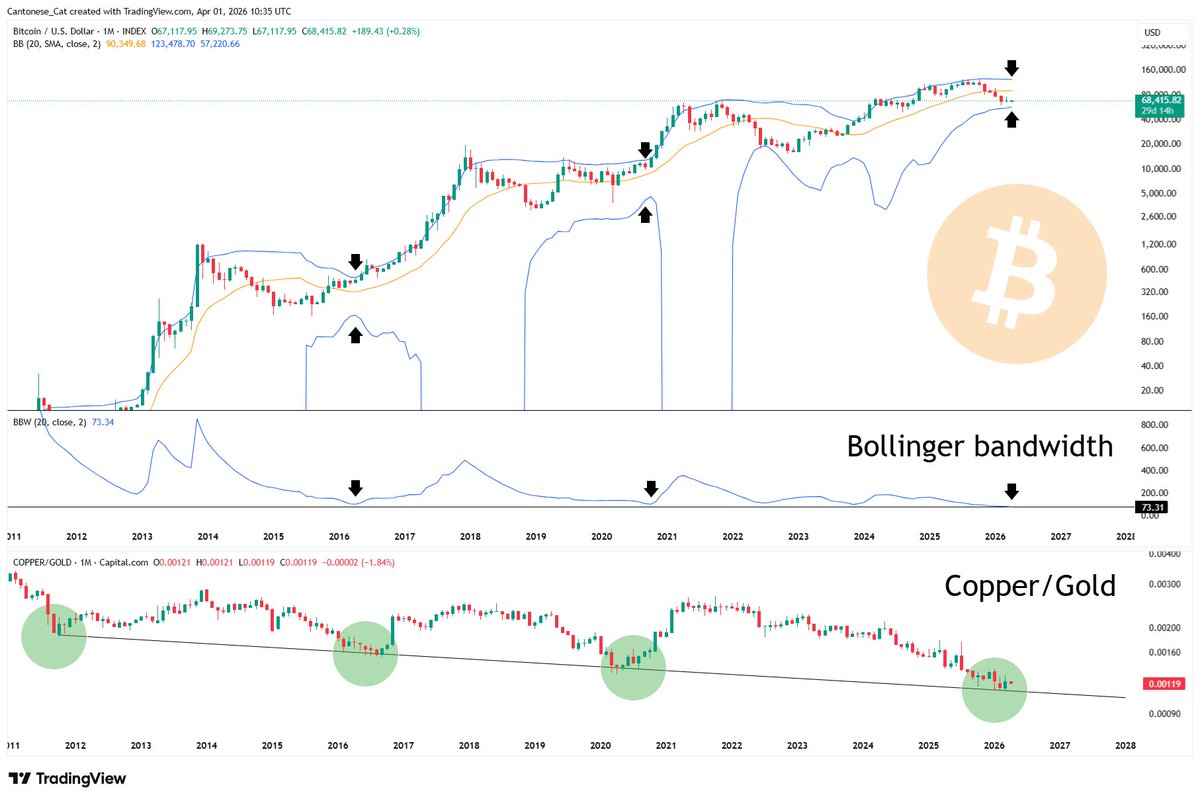
Bitcoin’s monthly Bollinger Bandwidth is the tightest its been on record, and combined with a potential bottom in the copper/gold ratio, this suggests the next major move may be higher.
Examine the entire post from Cantonese Cat.
The Chart Report curates best-in-class technical analysis from across the web.
If you’d like to share a chart or just say hello, email us at [email protected]