The Trump-Year Blueprint Is in Play 📈 The Chart Report

Chart of the Day
🏆 Today's Chart of the Day was shared by Jeffrey Hirsch.
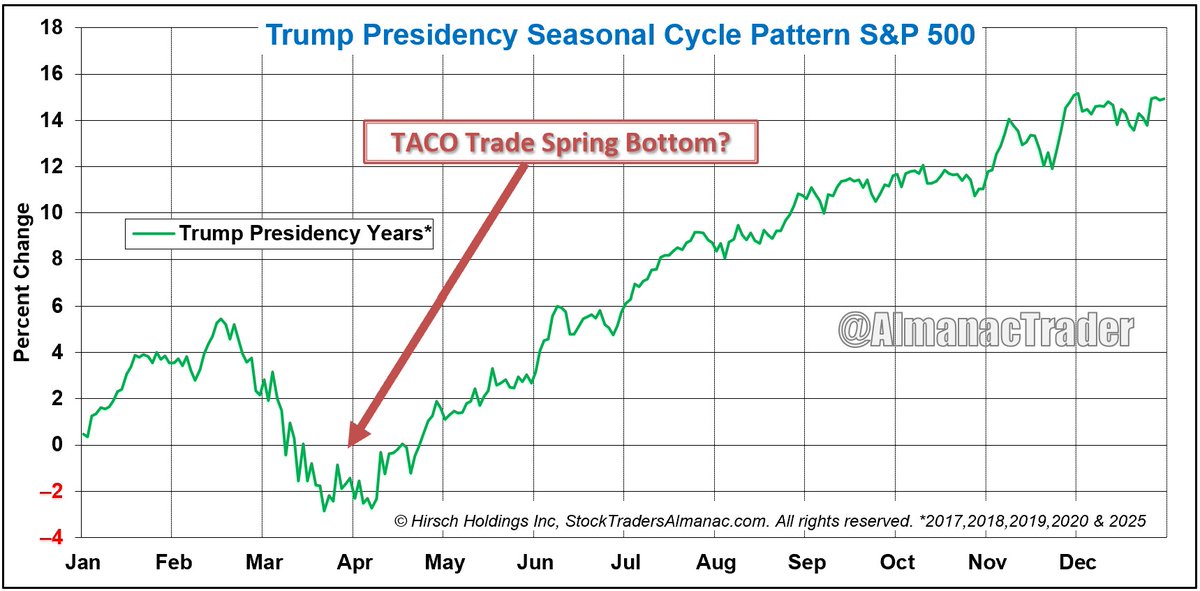
The typical playbook during Trump presidency years features early weakness in Q1, a springtime bottom, and a gradual push higher into year-end.
Of course, the most recent example that comes to mind is last year’s tariff-driven selloff, and so far, price is tracking a similar path.
While midterm years are often associated with volatility, they’ve historically held up better in a president’s second term compared to the first.
The Takeaway: The market is tracking a typical Trump-era pattern, with a potential spring low still in play.
More Great Charts
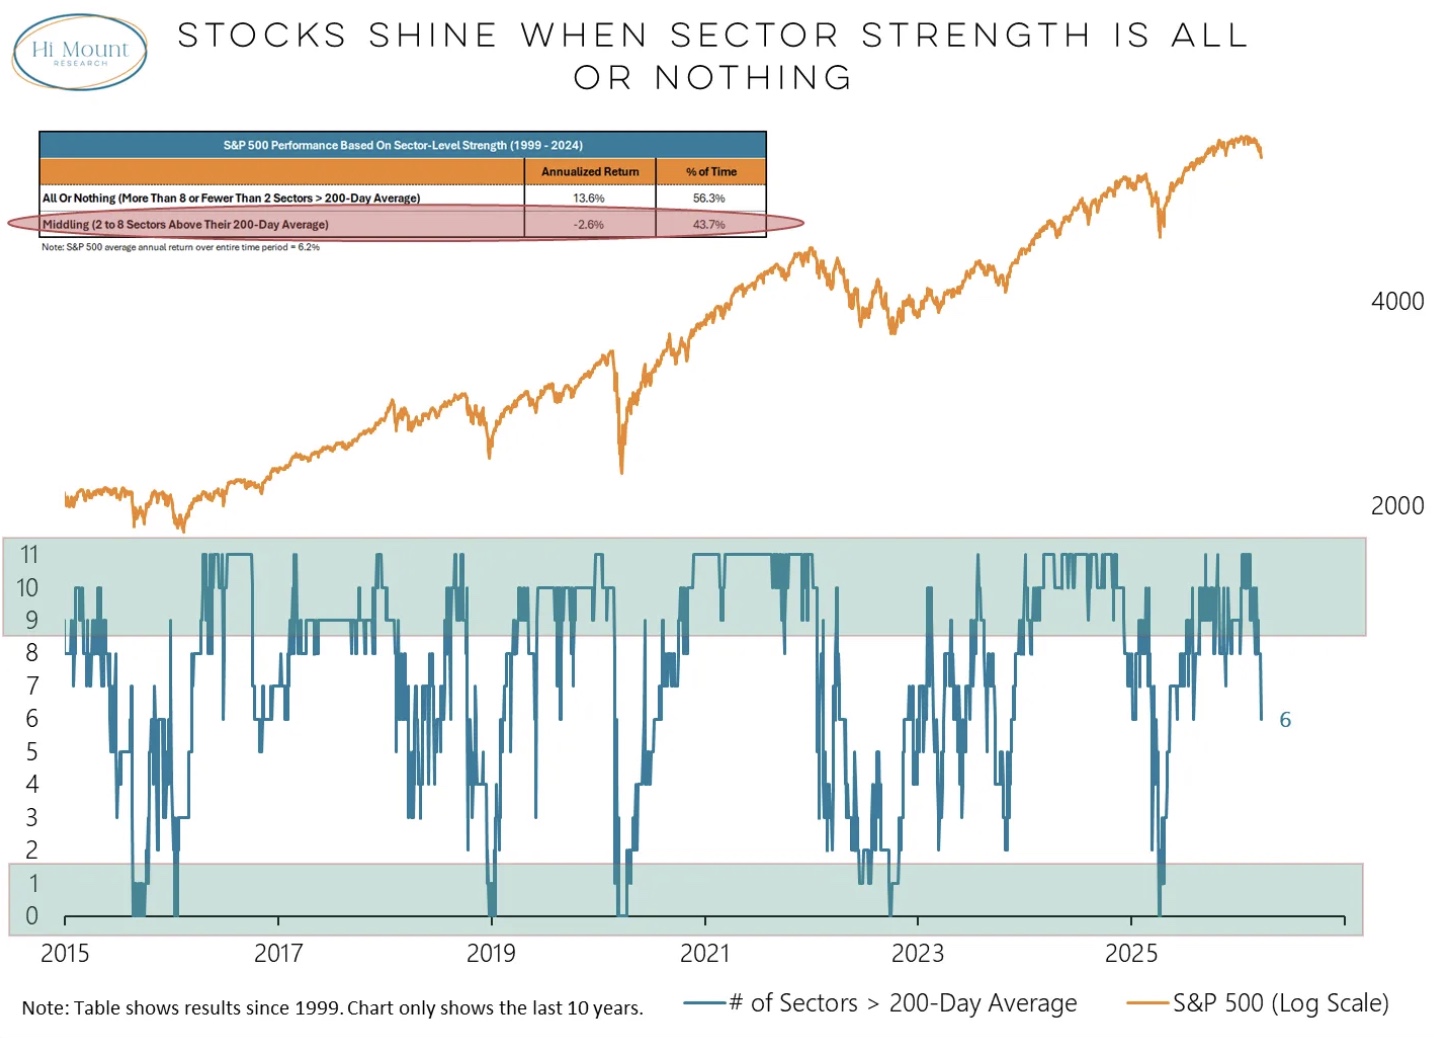
The S&P 500 delivers its strongest annualized returns when either more than eight or fewer than two sectors are above their 200-day moving average.
Access the full analysis from Willie Delwiche.
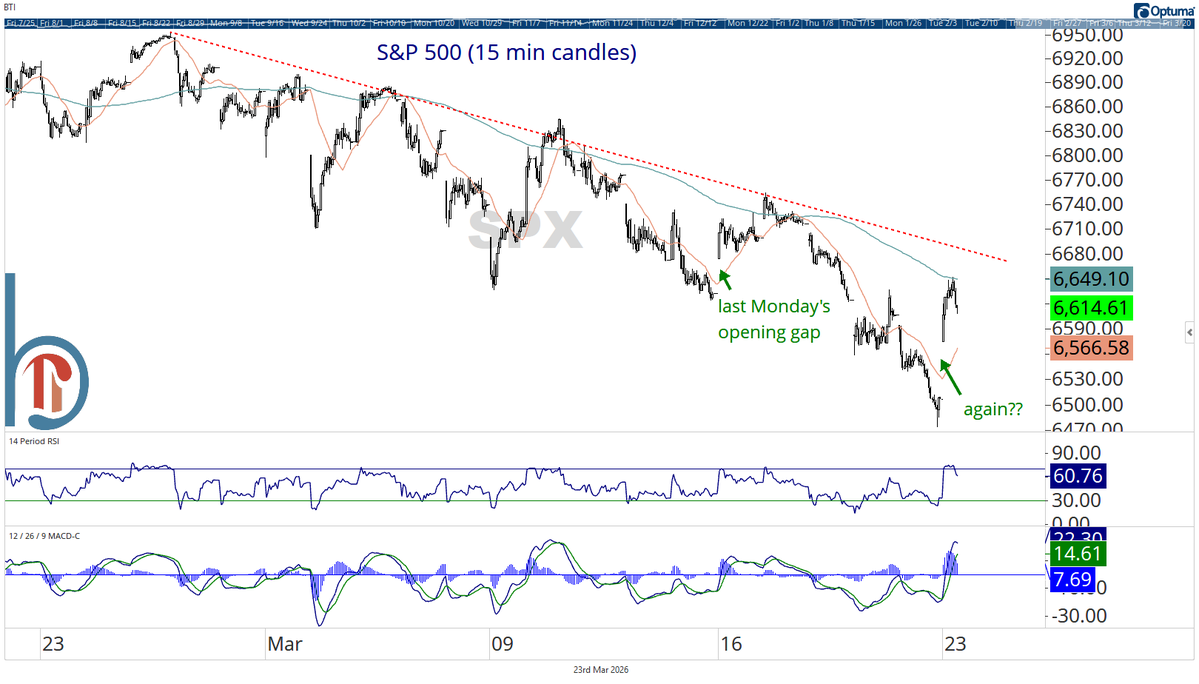
Sellers remain in control of the near-term downtrend for the S&P 500.
Check out the entire tweet from Scott Brown.
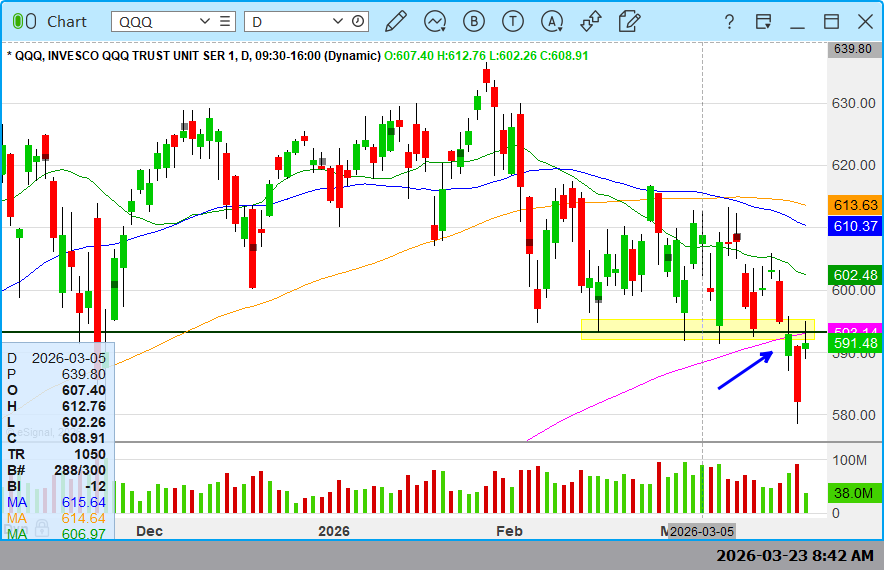
There's a solid amount of overhead supply around the $590 level for the Nasdaq 100.
View the complete post from HCPG.
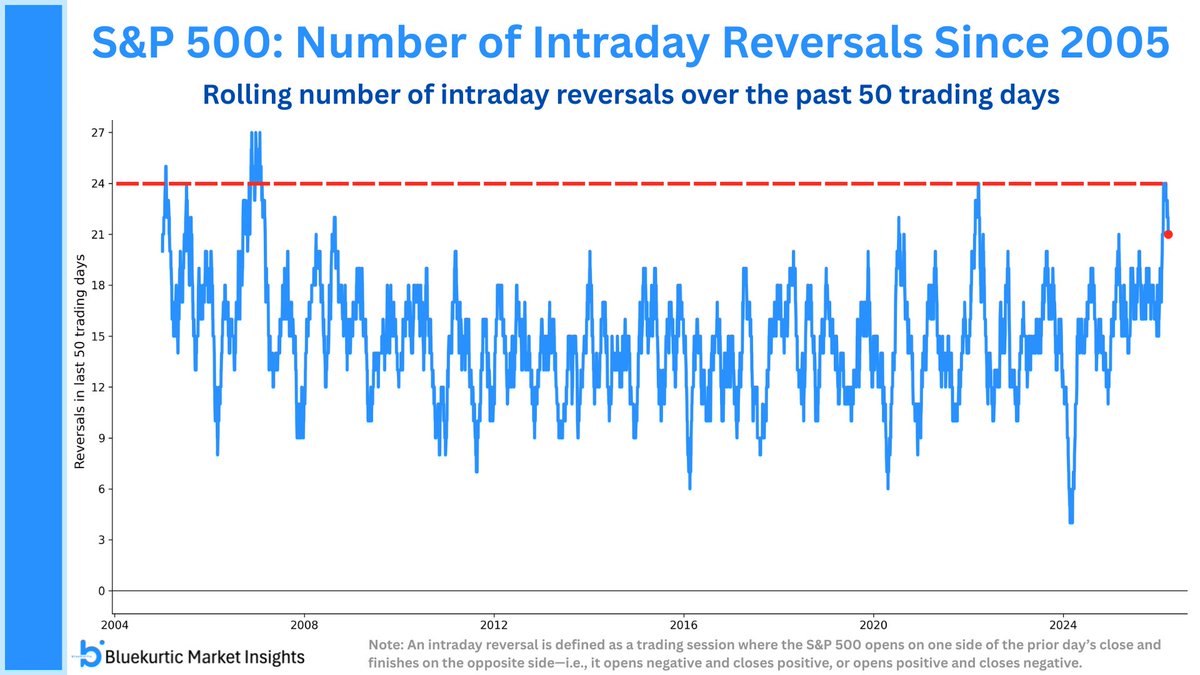
Over the past 50 sessions, we’ve seen the most intraday reversals since the 2022 bear market and the period leading up to the Great Financial Crisis.
See the whole post from Bluekurtic.
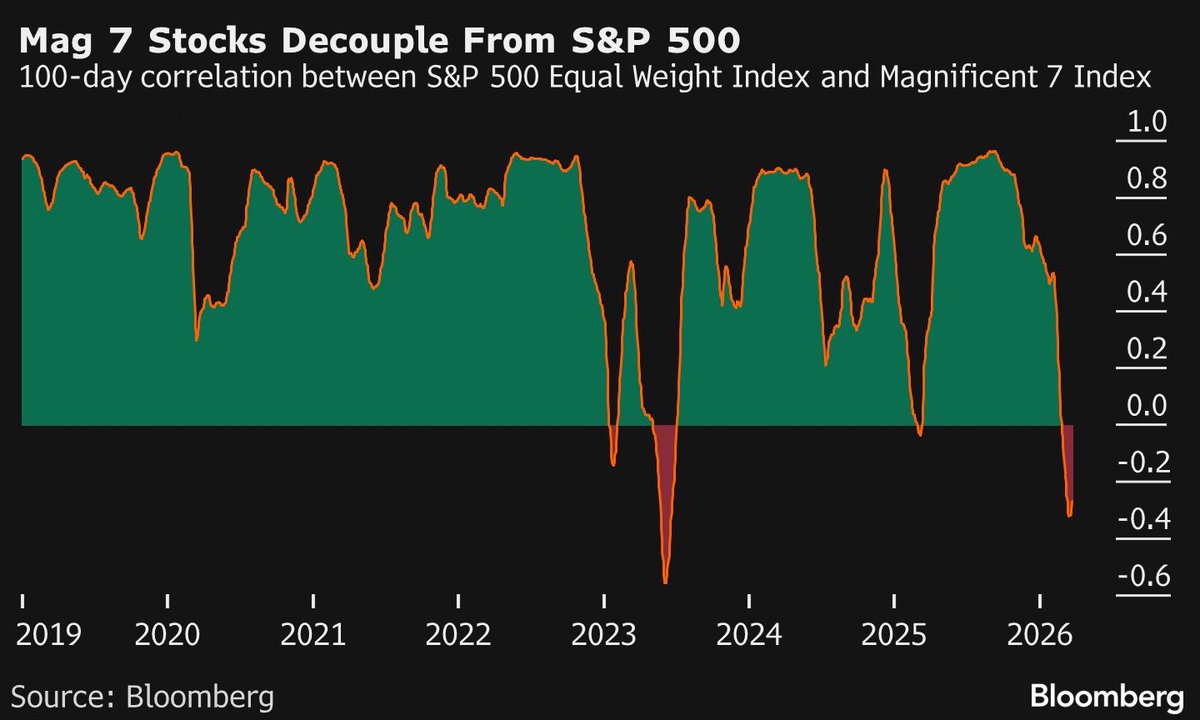
The last time correlations between the S&P 500 and the Mag Seven were this negative, it marked the start of sharp outperformance from Big Tech.
See the entire tweet from Menthor Q.
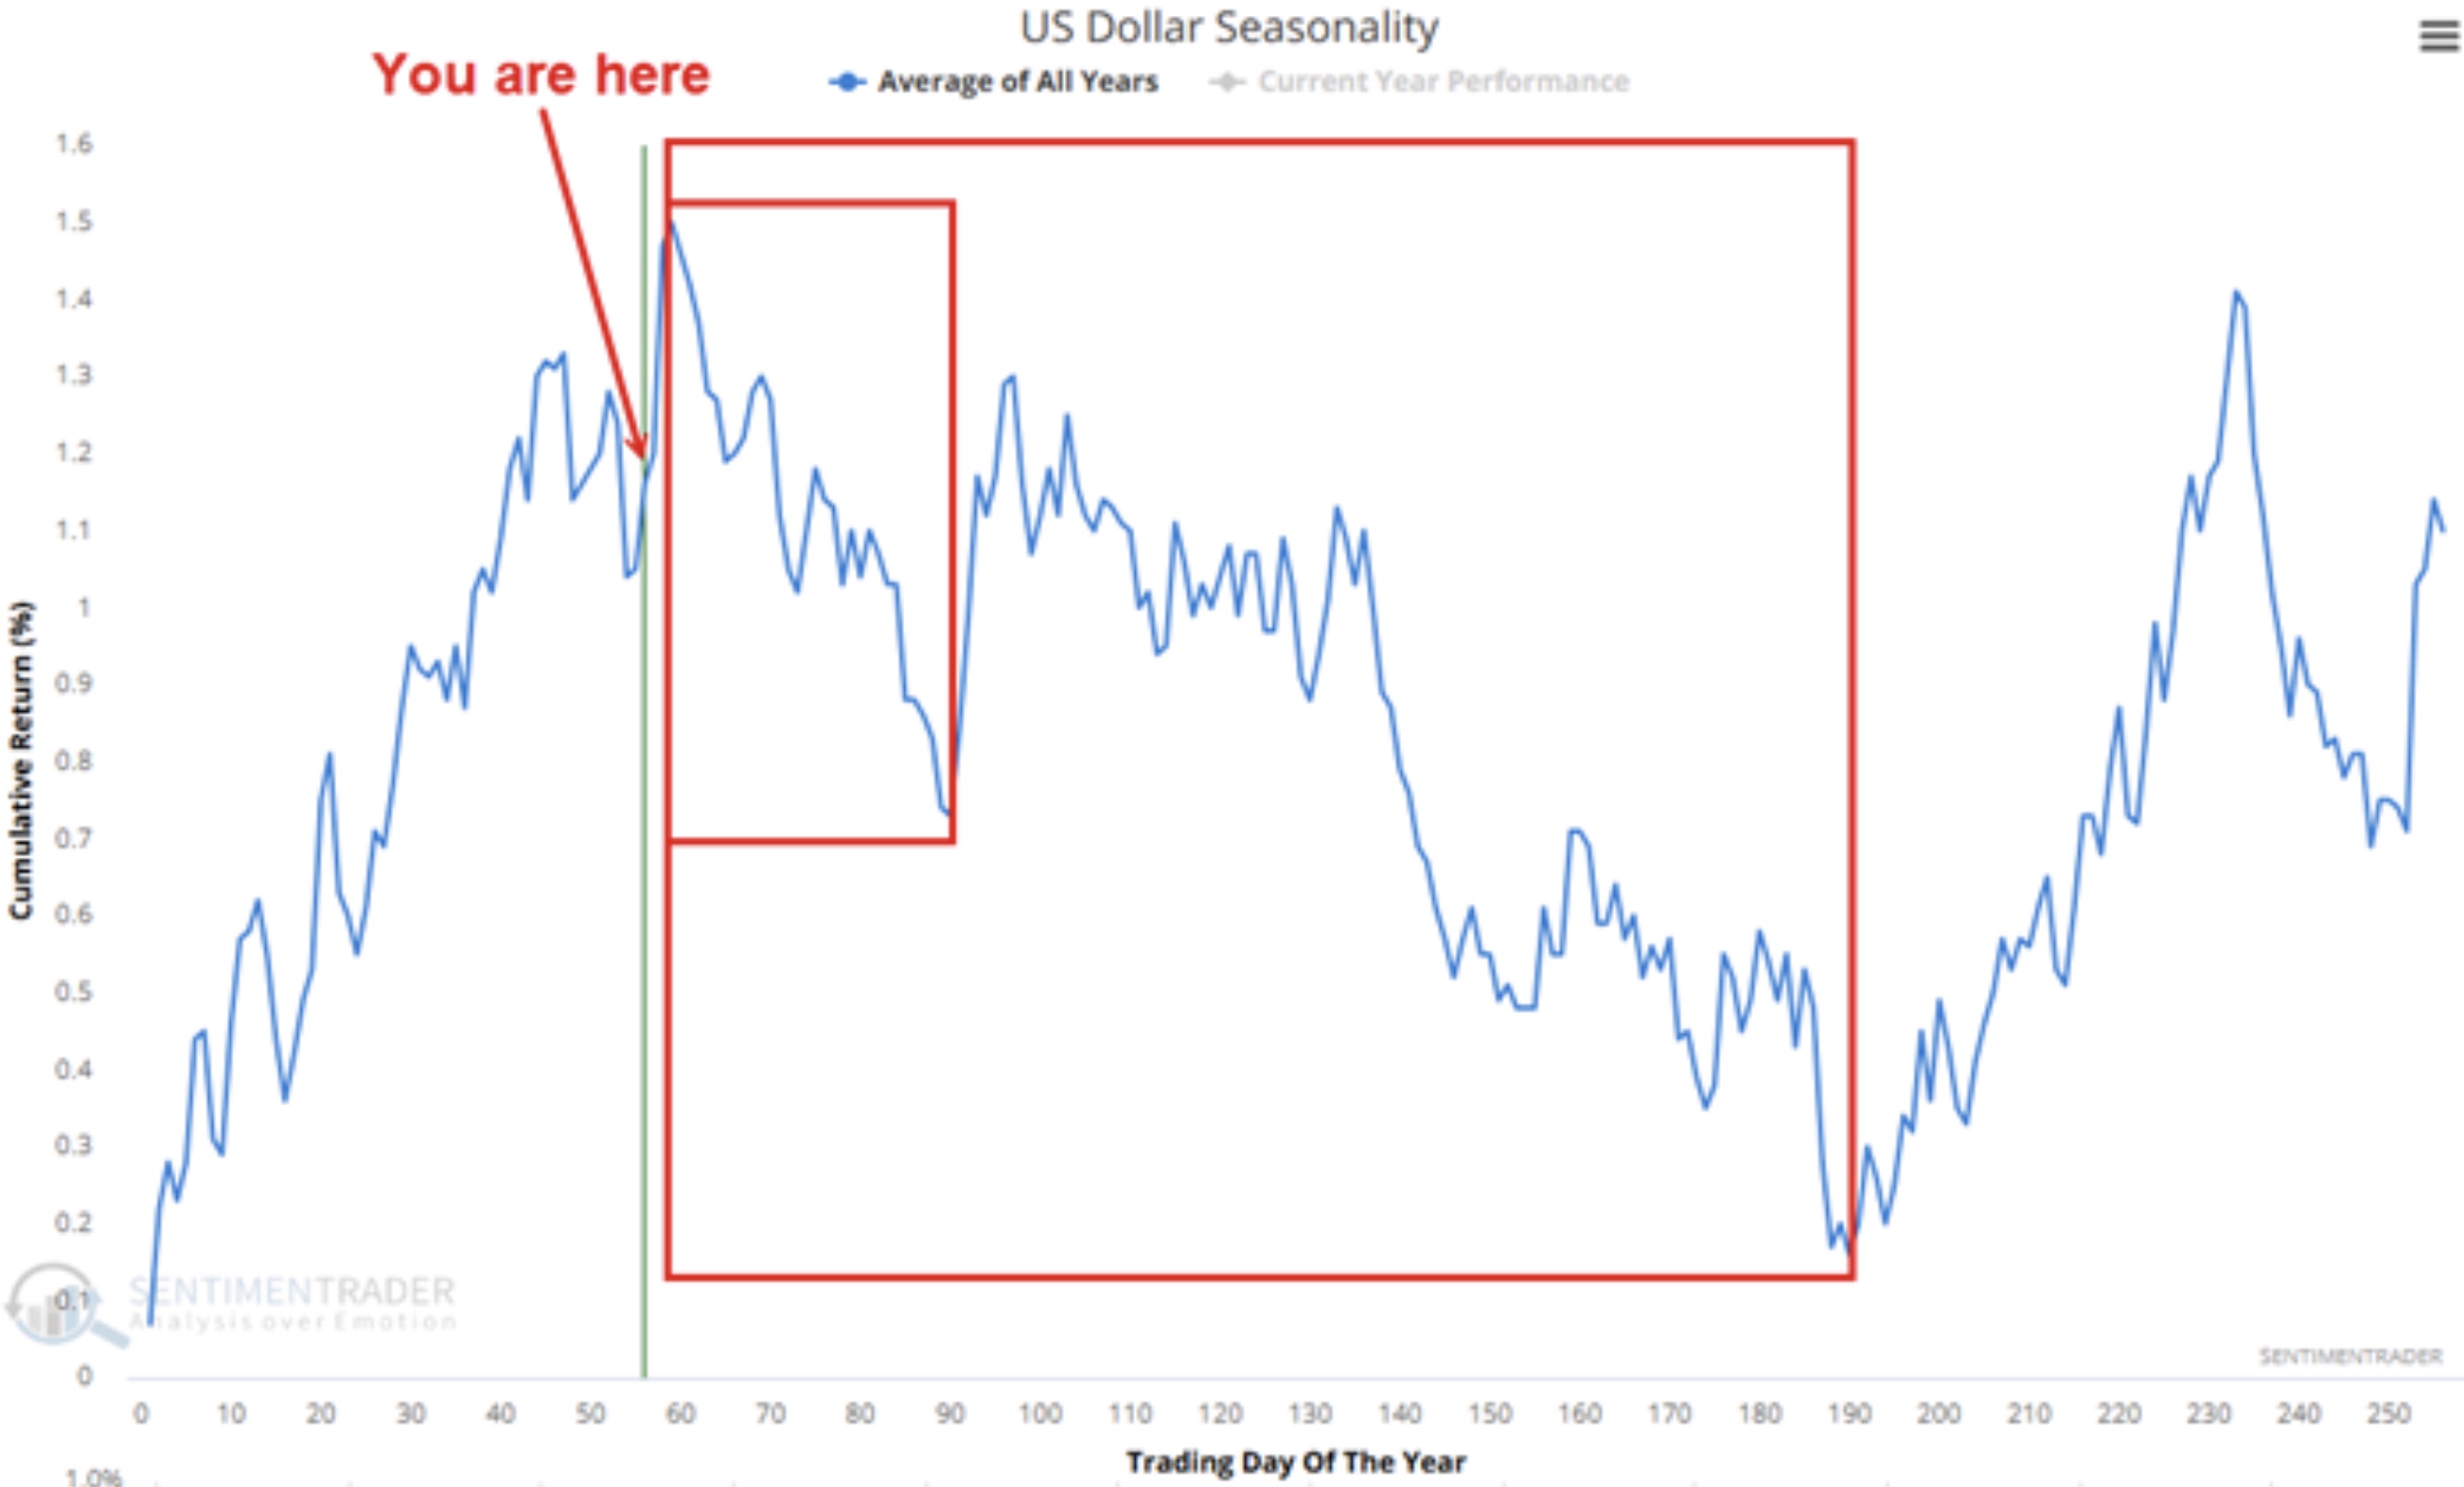
The U.S. Dollar tends to peak seasonally around this time, with a bottom typically forming in Q3.
Check out the full post from Jay Kaeppel.
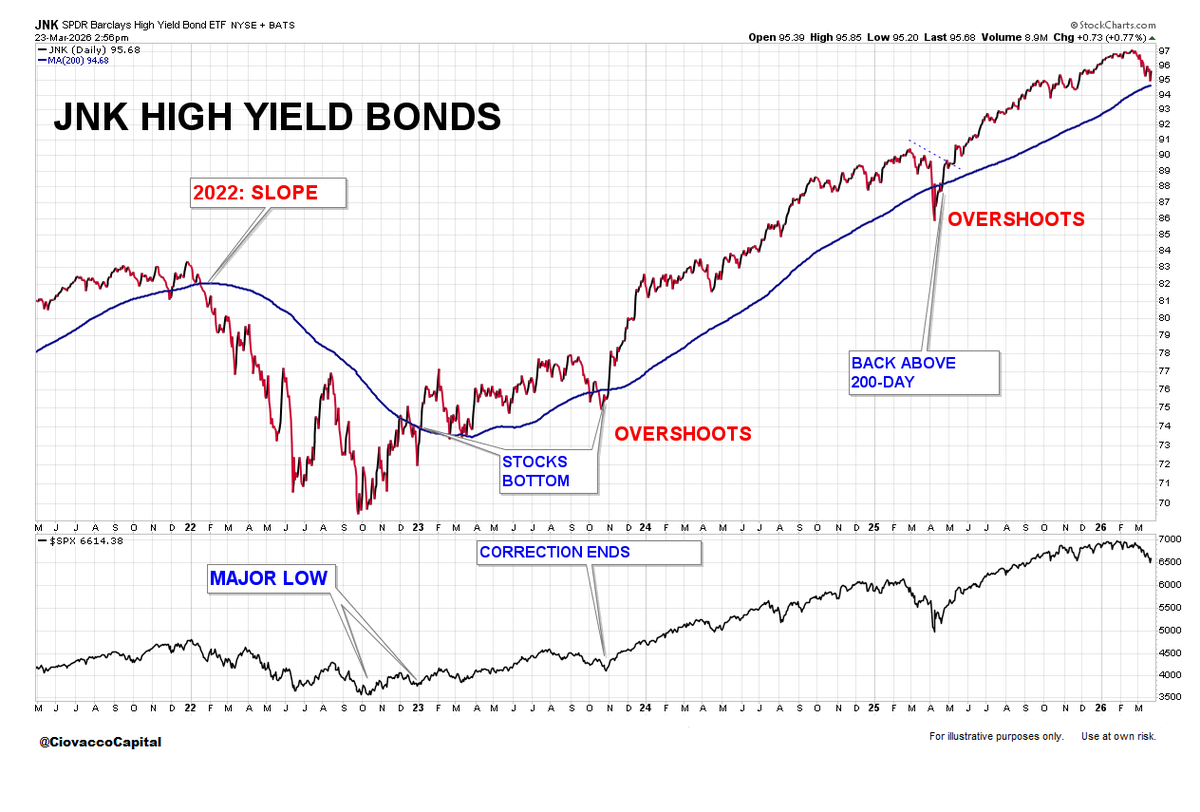
The High Yield Bond ETF is retesting its upward-sloping 200-day moving average.
View the entire tweet from Chris Ciovacco.
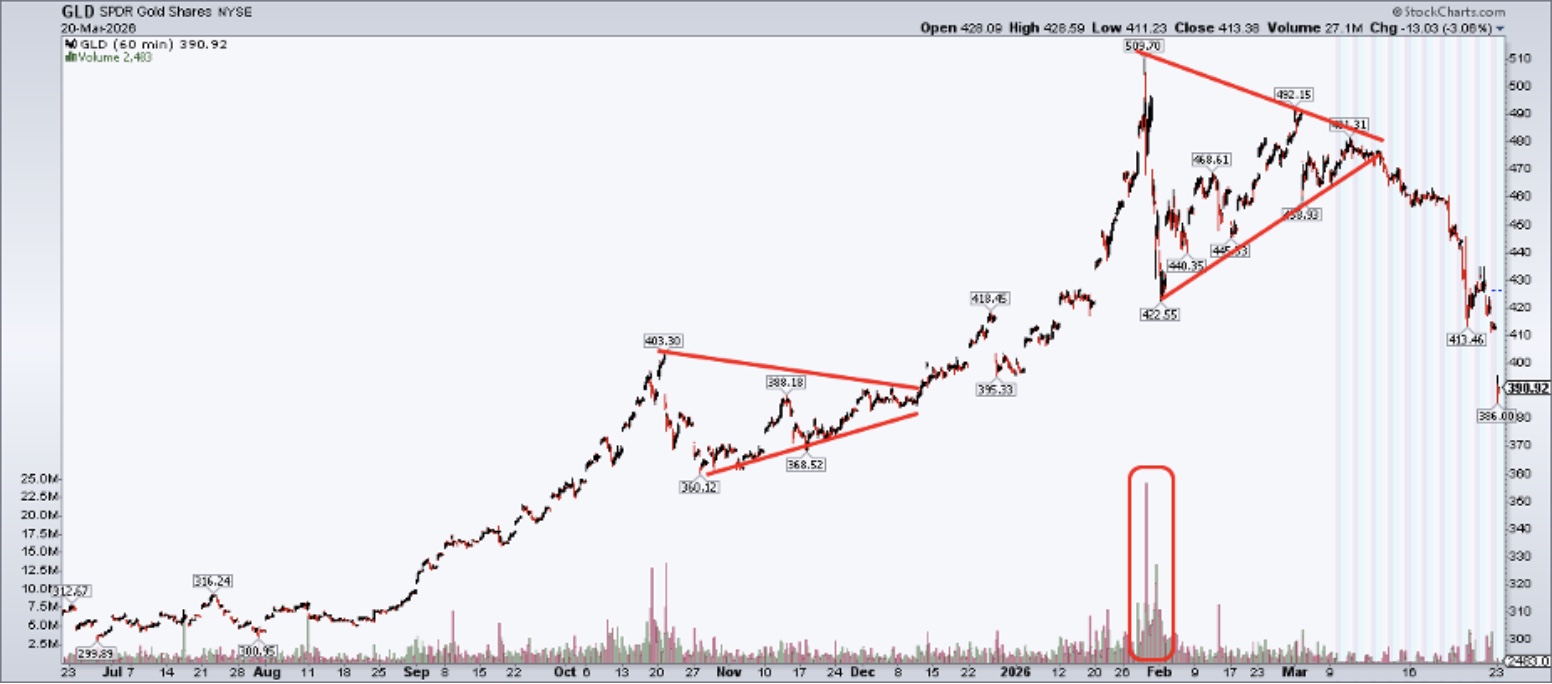
For Gold, the further price moves away from the January highs, the more that high-volume peak begins to resemble a potential blow-off top.
Read the latest article from Mike Zaccardi.
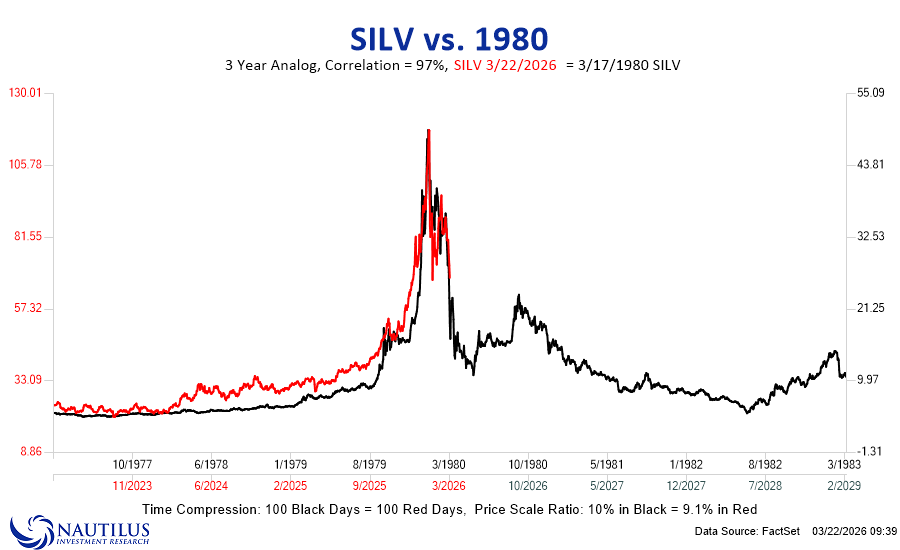
Silver's recent price action closely mirrors the run seen in 1980.
See the whole post form Nautilus Research.
The Chart Report curates best-in-class technical analysis from across the web.
If you’d like to share a chart or just say hello, email us at [email protected]