Sponsored By:

Today’s Summary
Wednesday, March 11th, 2020
Indices: It was another ugly day on Wall Street with the Dow Jones Industrial Average tumbling 1,465 points or 5.86%. The index has now officially entered bear market territory, as its fallen over 20% from its record high. The S&P 500 and Nasdaq dropped 4.89% and 4.70%, respectively. The Russell was the weakest of the major indices, plummeting 6.41%.
Sectors: All 11 sectors closed lower by more than 3.50%. Health Care led, but still closed lower by 3.82%. Industrials lagged, dropping 5.87%.
Commodities: Crude Oil futures tumbled 4.96% to $33.12 per barrel. Gold futures fell 0.87% to $1,635 per ounce.
Currencies: The US Dollar Index rose 0.13%.
Interest Rates: The US 10-year Treasury yield moved higher to 0.82%.
Here are the best charts, articles, and ideas being shared on the web today!
Chart of the Day
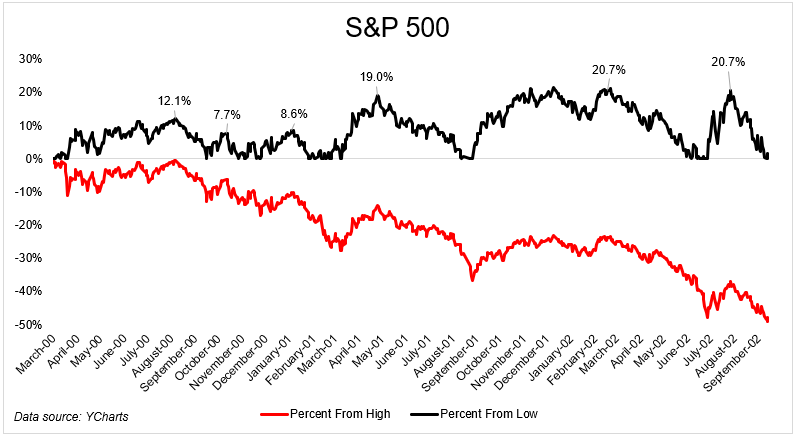
Today’s Chart of the Day was shared in a blog post titled Bear Market Rallies by Michael Batnick of Ritholtz Wealth Management. The chart shows the performance of the S&P 500 (in red) during the 2000-2002 bear market. On top, in black, are the bounces from the lows along the way down. The S&P 500 fell over 40% during this period! This chart serves as a great reminder that some of the sharpest rallies occur within bear markets and downtrends. Notice that the index rallied about 20% on three separate occasions during these two-years. Michael explains that bear markets often present great opportunities for traders. However, for long-term investors, he emphasizes that bear market rallies can be deceptive and mess your emotions. Check out the full blog post here.
Quote of the Day
“For those properly prepared, the bear market is not only a calamity but an opportunity.”
– Sir John Templeton (Investor)
Top Links
One of the Most Unique Moments in Market History – SentimenTrader
Jason Goepfert discusses some of the unprecedented price action we’re seeing across the markets right now.
Two Must-See Charts of the Nasdaq 100 and Crude Oil Futures – Bloomberg
In this clip from Bloomberg, Carolyn Boroden joins host Abigail Doolittle to outline some key levels to keep an eye on in the Nasdaq 100 and Crude Oil futures.
Intermarket Analysis: U.S. Equities Correction Getting Nasty – See It Market
Aaron Jackson takes a look at some important ratio charts that illustrate the risk-off environment that we’re currently in.
Here’s the Most Important Chart I’m Watching – StockCharts
Aleksandar Bozic suggests using the 40-month moving average to gauge the long-term trend on the S&P 500 ETF, $SPY.
Discretionary/Staples Indicator Looking Similar To 2007 Highs! – Kimble Charting Solutions
Chris Kimble examines a ratio chart of Consumer Discretionary vs. Consumer Staples ($XLY/$XLP). He warns that further weakness from this important risk-appetite indicator would be bearish for the broader market.
Top 10 Tweets
This log chart shows how much more serious the 2007-08 crash was compared to today. At least, so far. pic.twitter.com/r86lDAllnS
— Eddy Elfenbein (@EddyElfenbein) March 11, 2020
when monthly RSI falls below 45, bad things tend to happen. this is another longer term chart I'm watching $SPX pic.twitter.com/N50TdQkYAU
— BostonCharts (@bostonchaahhts) March 11, 2020
$SPY Last time we gave back 20%, started getting close to 200 week, and hit oversold on RSI we had a 40+% rally in the next year. Not bullish here but trying to be open minded. It's hard sometimes! pic.twitter.com/KK9LFO5X9p
— Gregory Krupinski (@G_krupins) March 11, 2020
On an intra-day level the S&P 500 Index is down more than 20%. If it stays like this, it took just 16 trading days to get to a #bearmarket pic.twitter.com/e1DLHift7e
— jeroen blokland (@jsblokland) March 11, 2020
The 200-day EMA for $SPY rolled over as the 5-day ROC turned negative on March 2nd. This means the EMA is now falling. Thus, SPY is below the falling 200-day EMA. The 200-day SMA has yet to turn down, but the upward slope is deteriorating rapidly. $SPX pic.twitter.com/OlvDdaubw9
— Arthur Hill, CMT (@ArthurHill) March 11, 2020
Russell 2000 intraday just dipped below Christmas Eve 2018 low & stands to wipe out > 3 years’ worth of gains pic.twitter.com/4IBe8WjVn8
— Liz Ann Sonders (@LizAnnSonders) March 11, 2020
Small-Caps are very oversold. pic.twitter.com/MQzFNMOm8G
— Strategas (@StrategasRP) March 11, 2020
The Value Line Geometric Index is now back near its 2015 low. $VLG pic.twitter.com/LF6tDfwqks
— Andrew Thrasher, CMT (@AndrewThrasher) March 11, 2020
BAYCREST: “We think Treasury bonds have put in at least a tactical top, if not a much more meaningful one. Time will tell on the later. Right now our confidence is higher in a top for bonds than it is for a bottom in equities.” – @jkrinskypga pic.twitter.com/Ad9UsIHycv
— Carl Quintanilla (@carlquintanilla) March 11, 2020
Financial media are more concerned about "why" the market fell today or over the last few weeks…
Instead of the behavior of the price trend, behavior & position of other investors, and probabilities of an economy tipping into a recession.
The "why" is not that important.
— Tiho Brkan (@TihoBrkan) March 11, 2020