It's Energy’s Turn in the Commodity Cycle 📈 The Chart Report

Chart of the Day
🏆 Today's Chart of the Day was shared by Jason Perz.
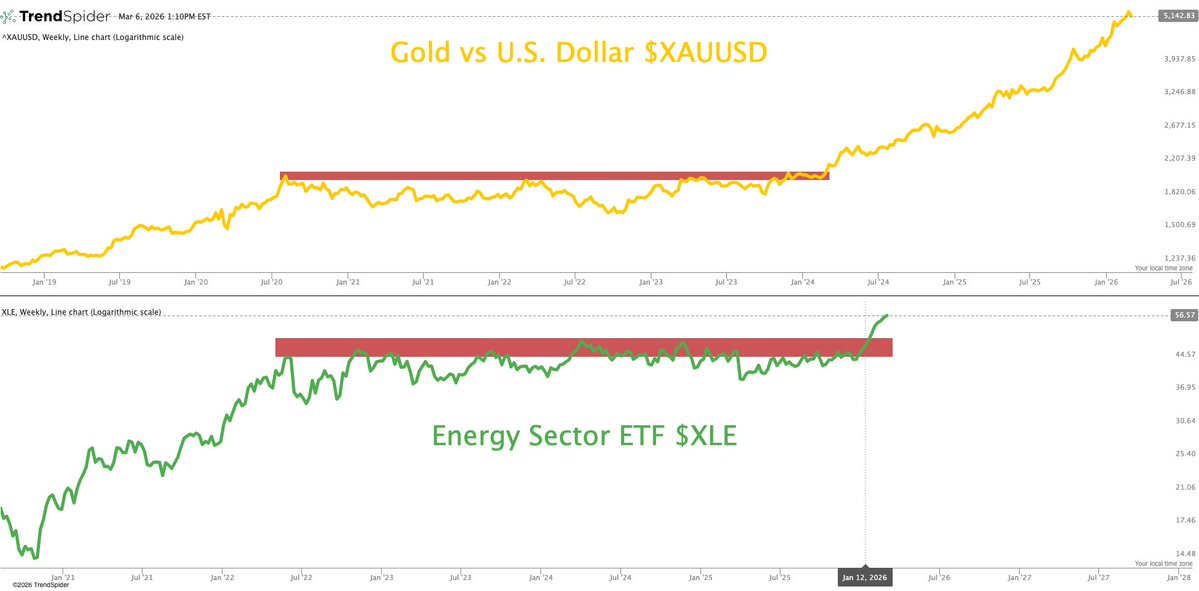
The Energy Sector ETF ($XLE) closed at a new all-time high this week, while crude oil futures are on track for their best week in history.
In commodity bull markets, gold and metals tend to move first, with oil often following later in the cycle.
$XLE looks similar to how gold traded before its parabolic run, and could offer a potential blueprint for the path ahead in the Energy sector.
The Takeaway: Energy may be entering the next phase of the commodity cycle amid historic gains in crude oil.
More Great Charts
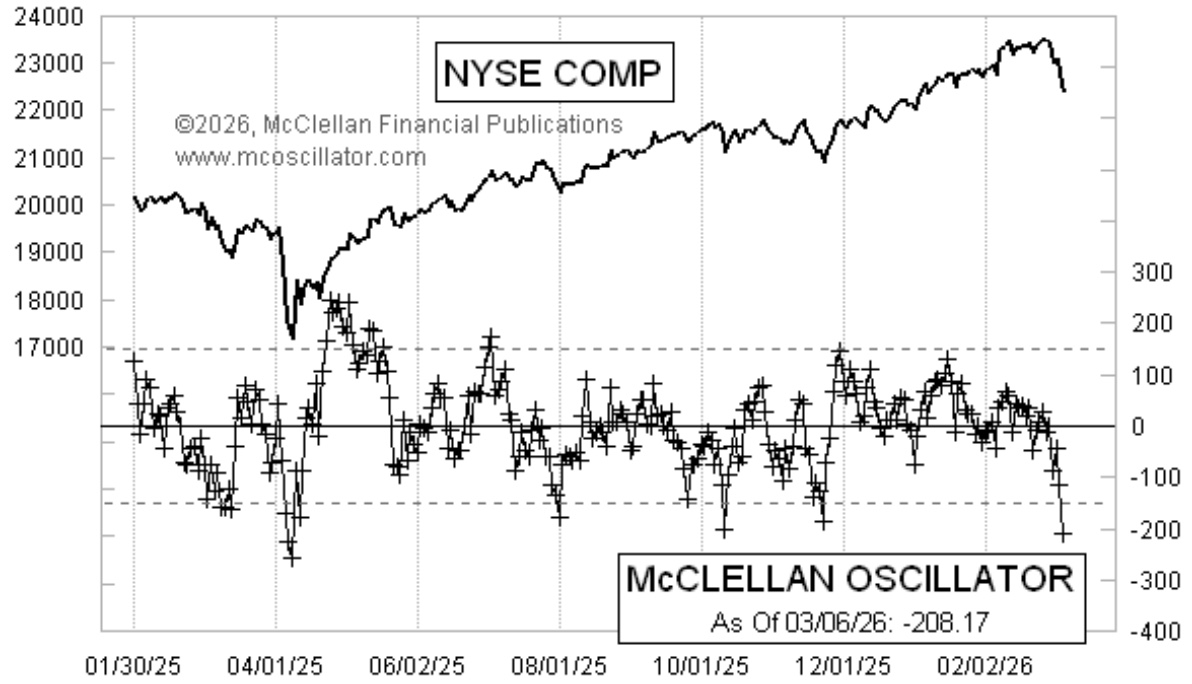
The NYSE’s McClellan A-D Oscillator has plunged to deeply oversold levels.
See the full tweet from Tom McClellan.
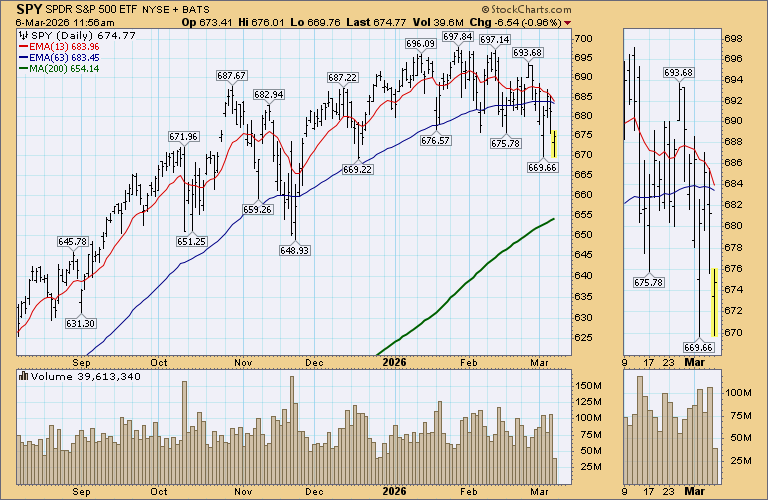
The S&P 500 is at risk of breaking below its December pivot lows.
View the complete post from Walter Deemer.
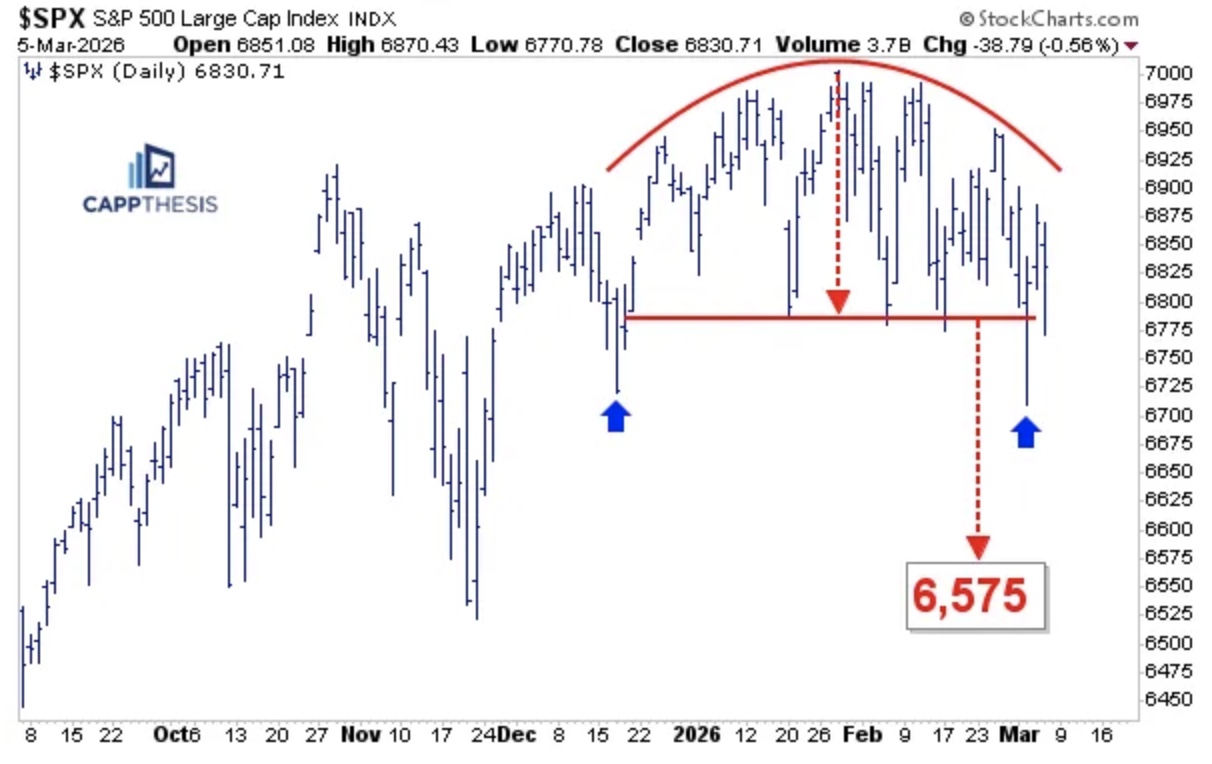
A completion of this rounded top would imply a downside target near 6575 for the S&P 500.
Read the full analysis from Frank Cappelleri.
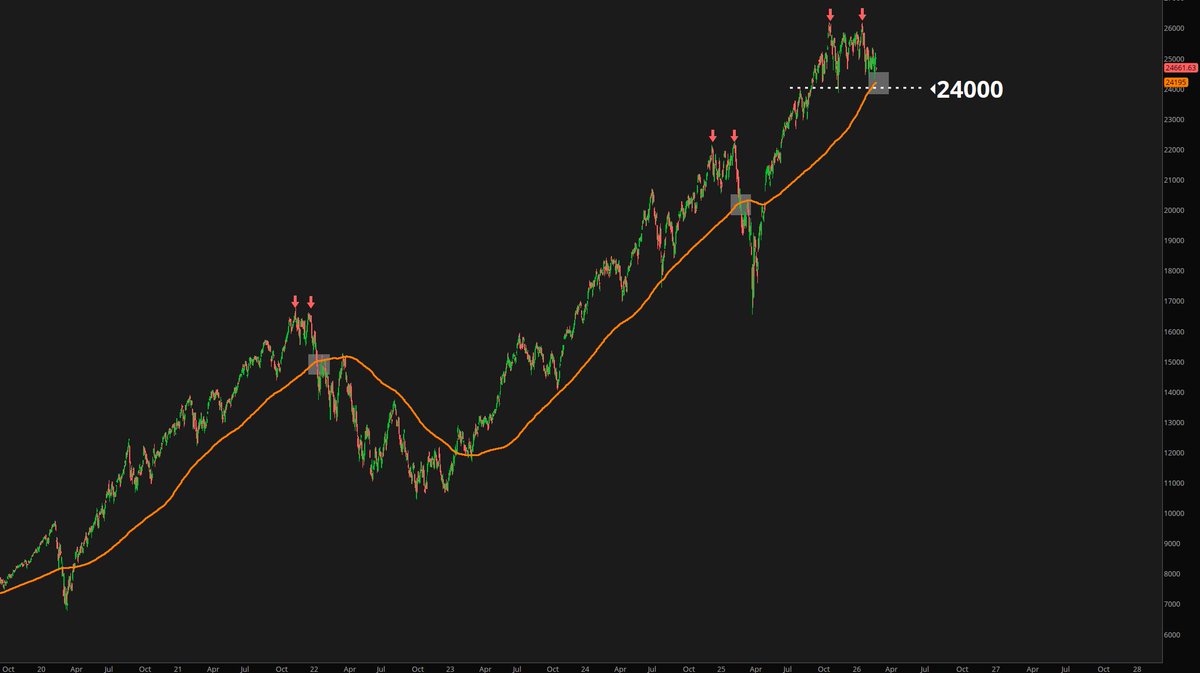
24,000 remains the key level for the Nasdaq 100, which also aligns with the 200-day moving average.
Check out the whole tweet from Yuriy Matso.
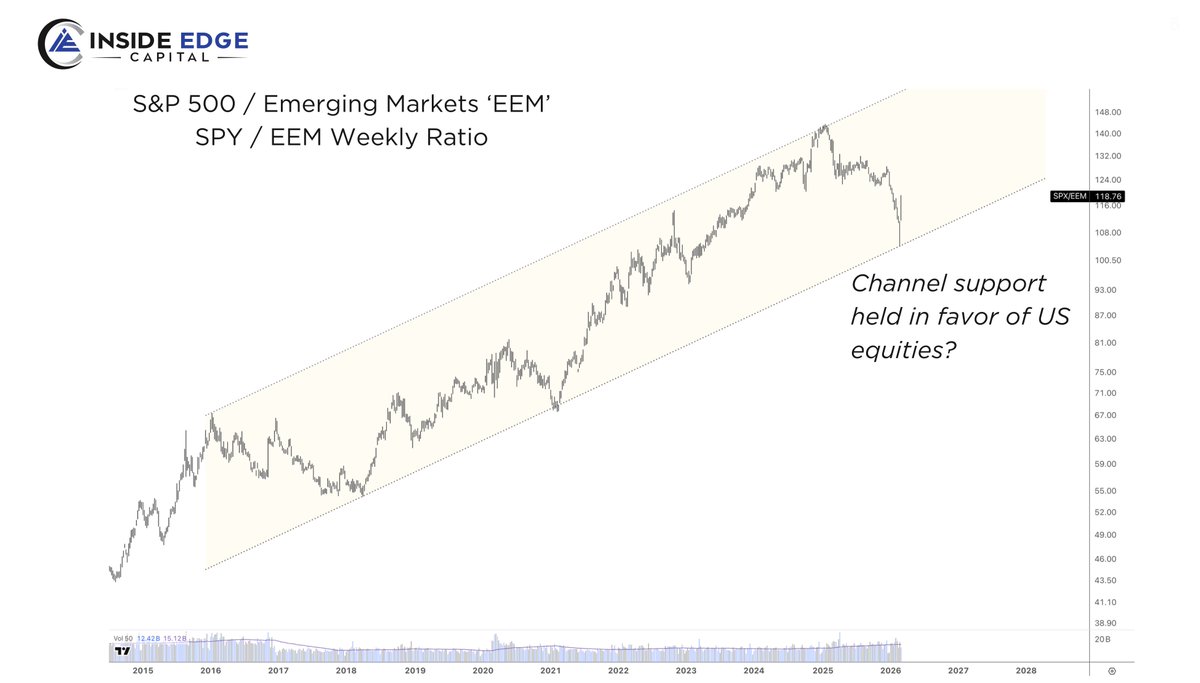
The S&P 500 relative to Emerging Markets has continued to hold decade-long channel support.
Watch the latest commentary from Todd Gordon.
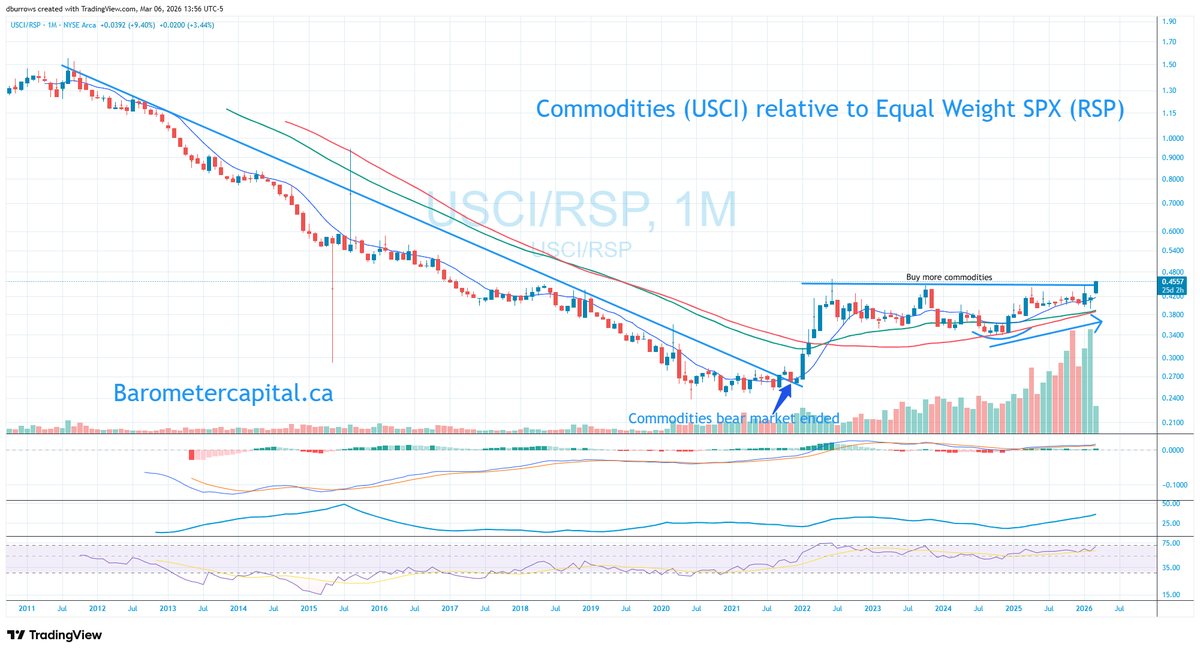
Commodities relative to the Equal Weight S&P are resolving higher from a multi-year consolidation.
View the entire post from David Burrows.
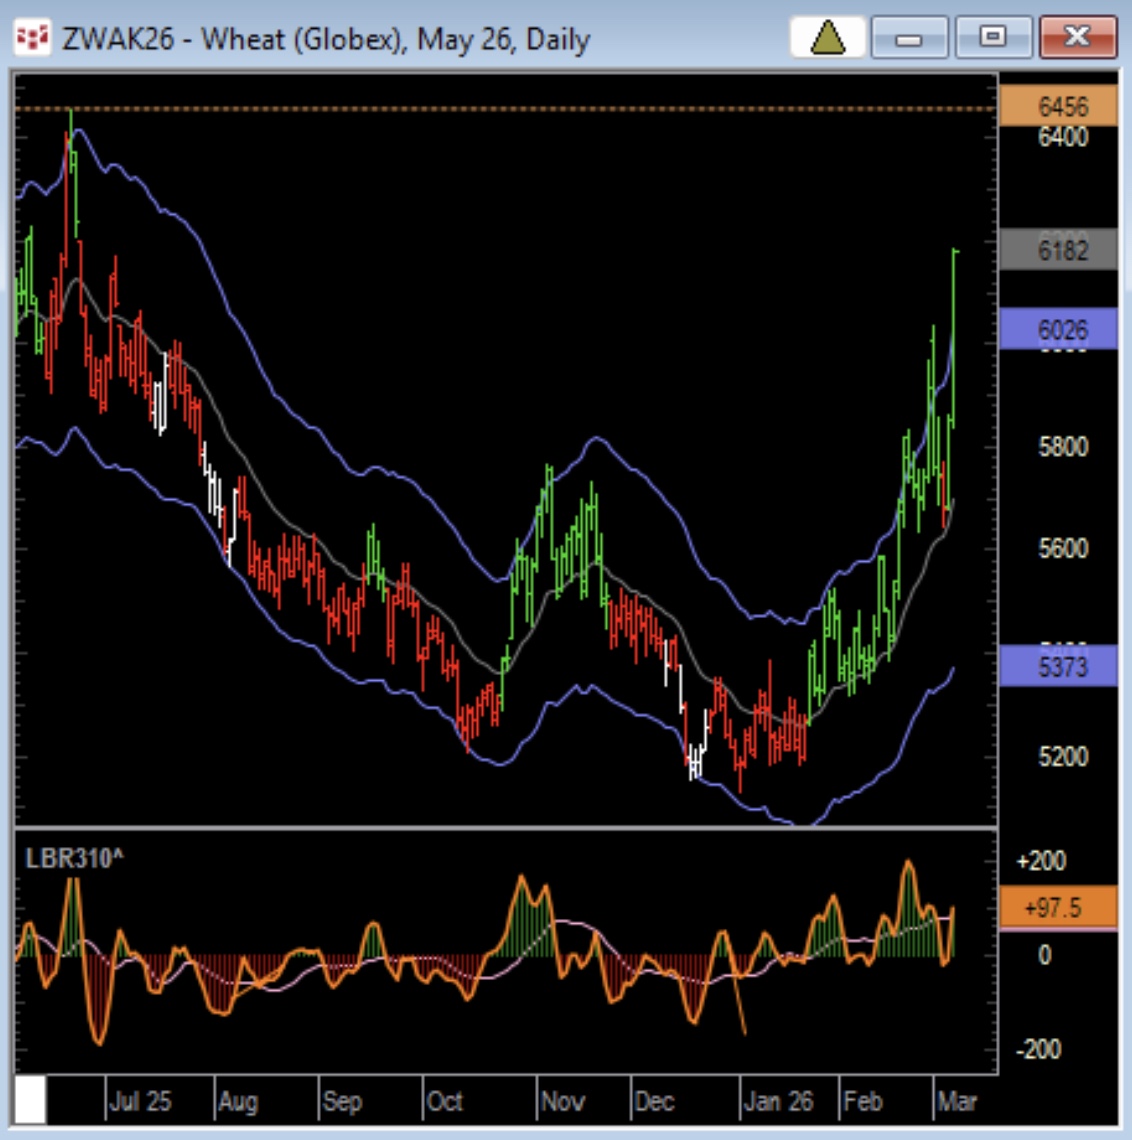
Wheat made new 9-month highs today, marking its best performance since Valentine’s Day 2025.
See the full tweet from Linda Raschke.
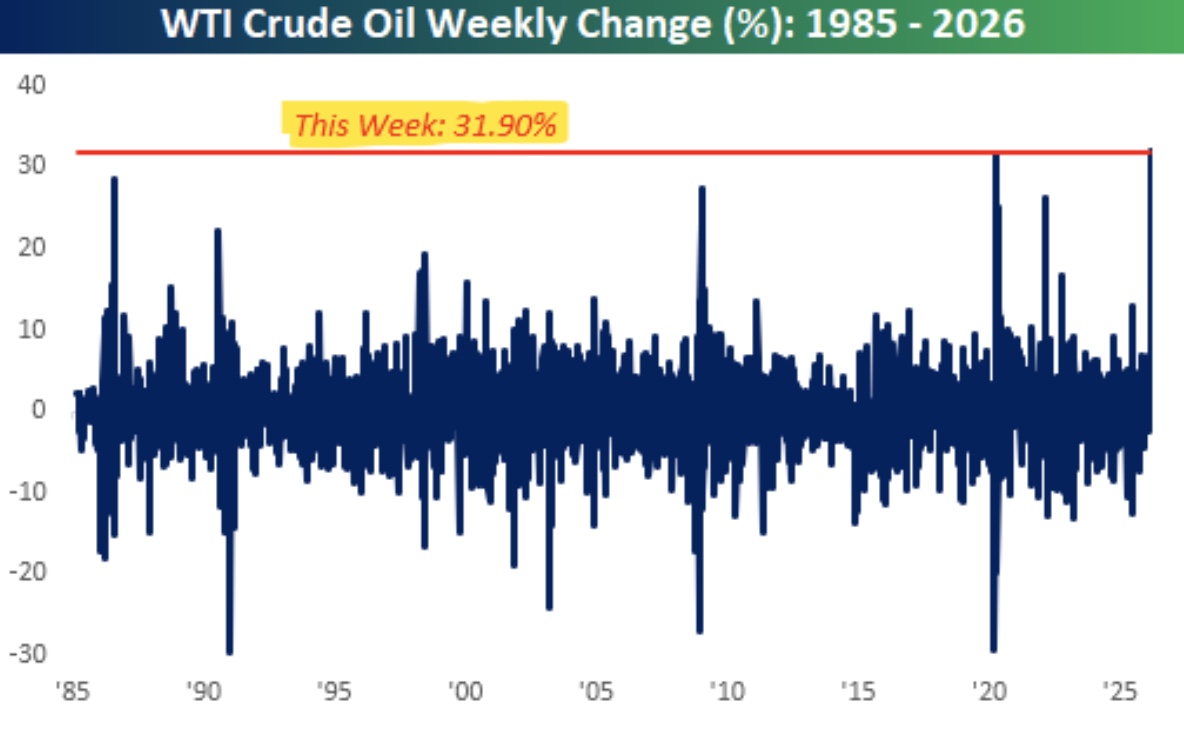
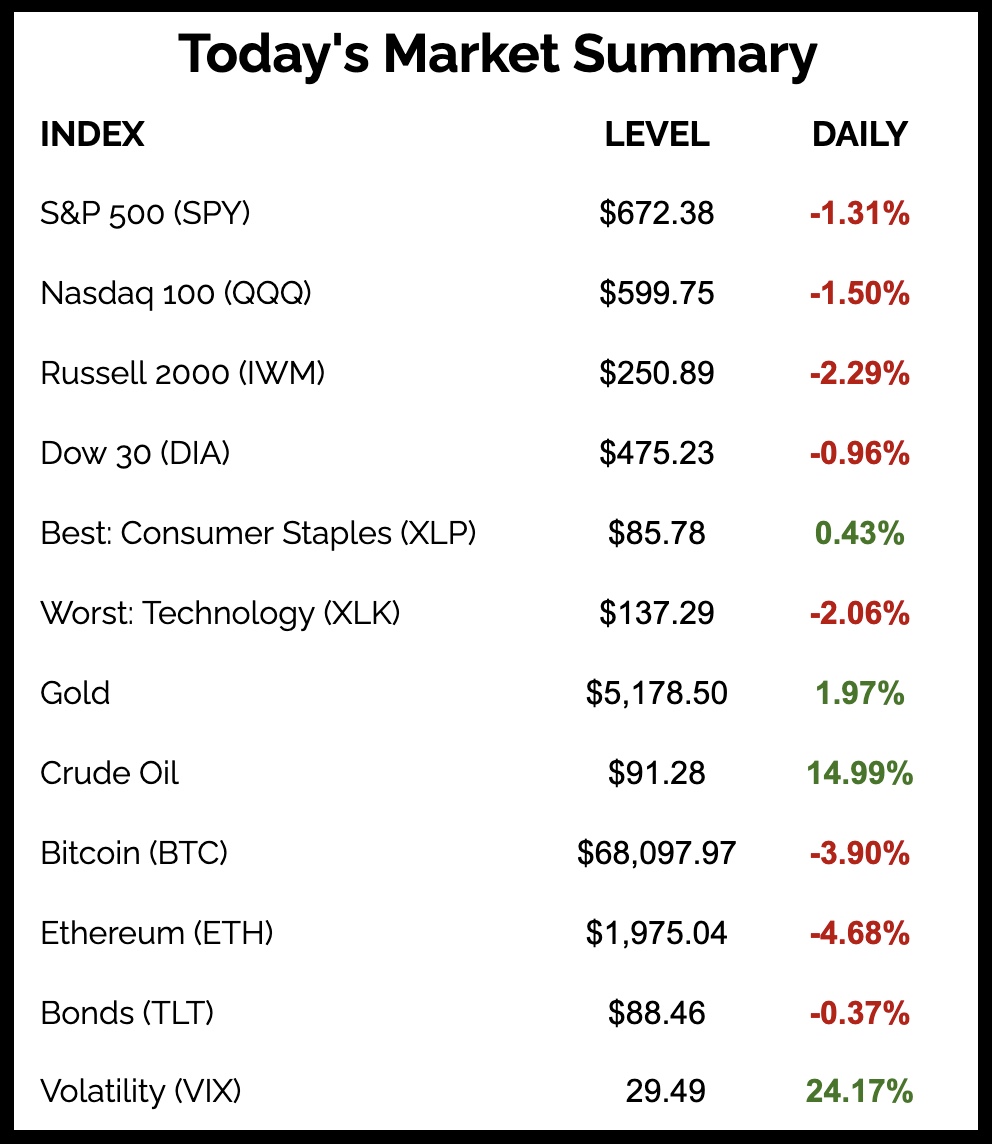
Crude Oil is on track for its best week ever.
Access the complete article from Bespoke.
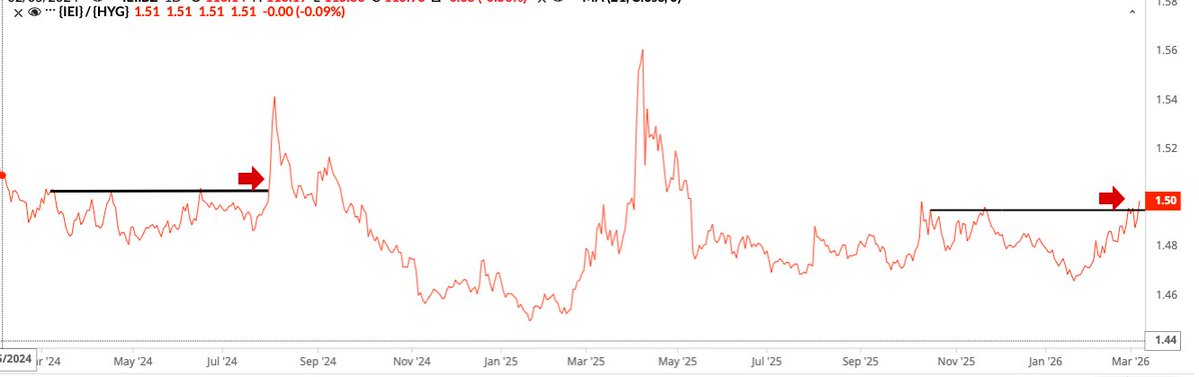
Credit spreads are widening, with a setup similar to the spring 2024.
Check out the entire post from Stacey Lee.
The Chart Report curates best-in-class technical analysis from across the web.
If you’d like to share a chart or just say hello, email us at info@thechartreport.com