All Eyes on the U.S Dollar 📈 The Chart Report

Chart of the Day
🏆 Today's Chart of the Day was shared by Alfonso De Pablos.
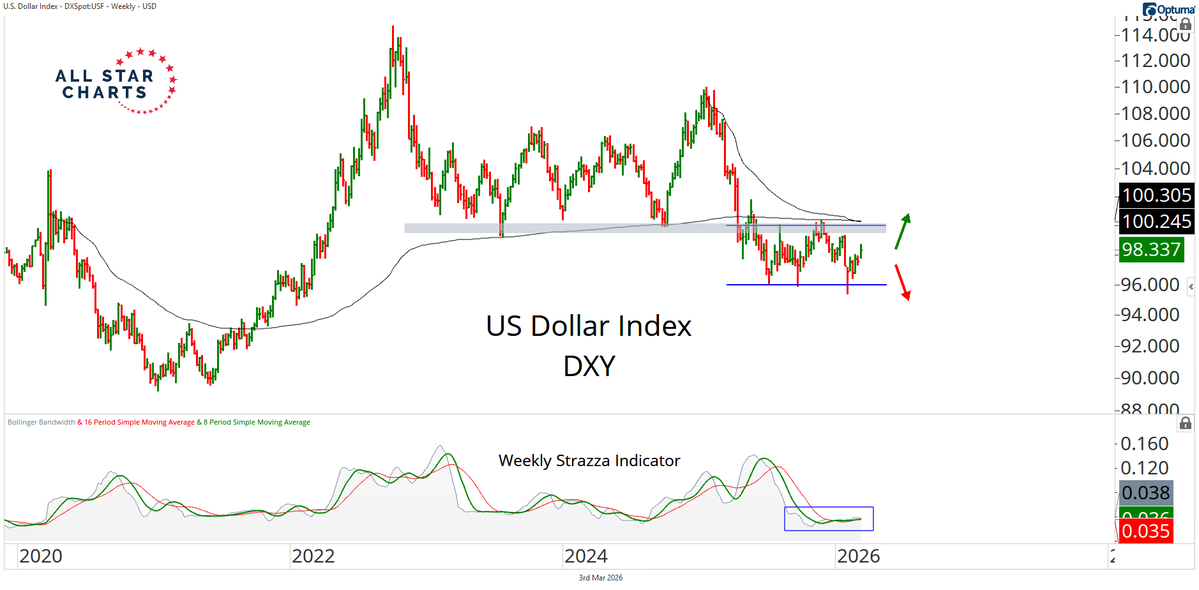
The U.S. Dollar Index ($DXY) made a new year-to-date high before fading into the close, though it still finished the session higher.
Volatility remains extremely compressed, and given the duration of this consolidation, a range expansion is likely to be forceful.
A move back above the confluence of resistance near 100 would represent a meaningful tailwind for the broader market.
The Takeaway: The dollar is consolidating just below major polarity, and its next move is likely to set the tone for risk assets.
More Great Charts
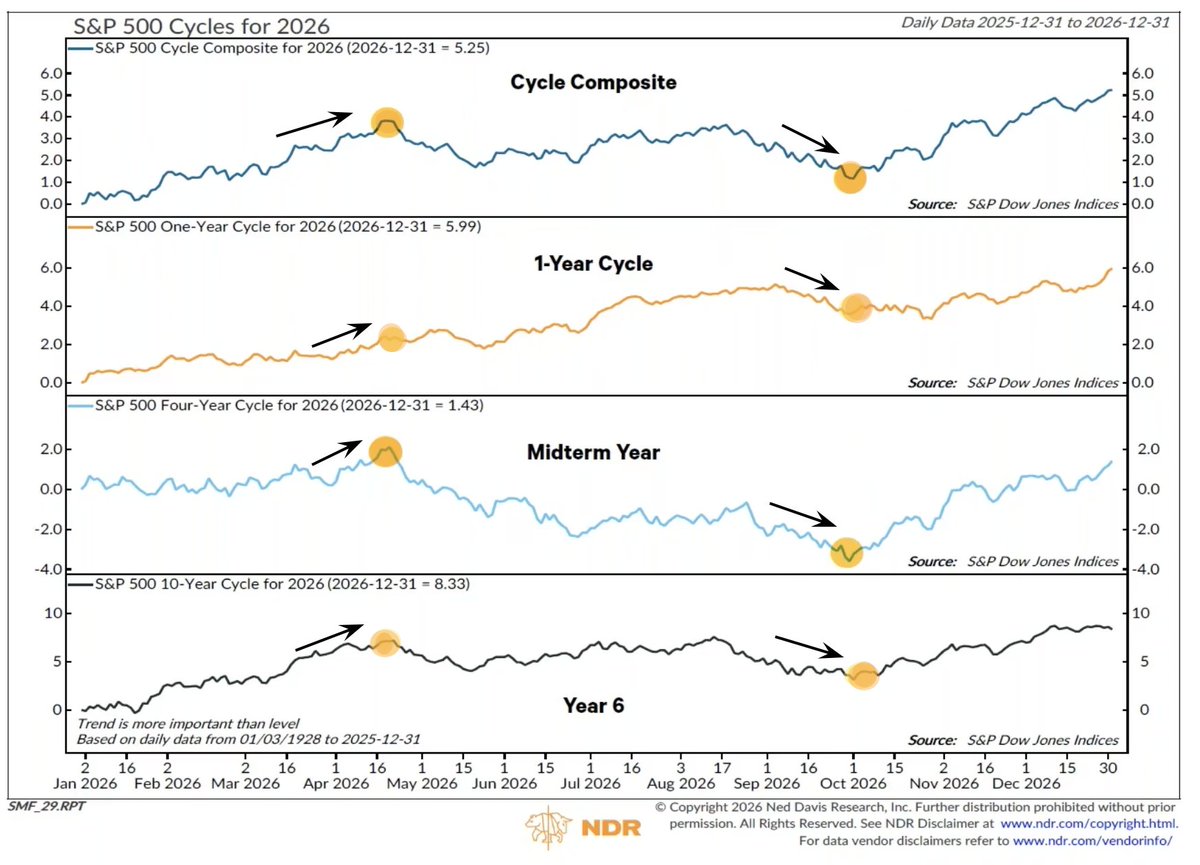
Almost every major cycle composite for 2026 points to a peak in Q2 before bottoming out in Q4.
Check out the full tweet from Seth Golden.
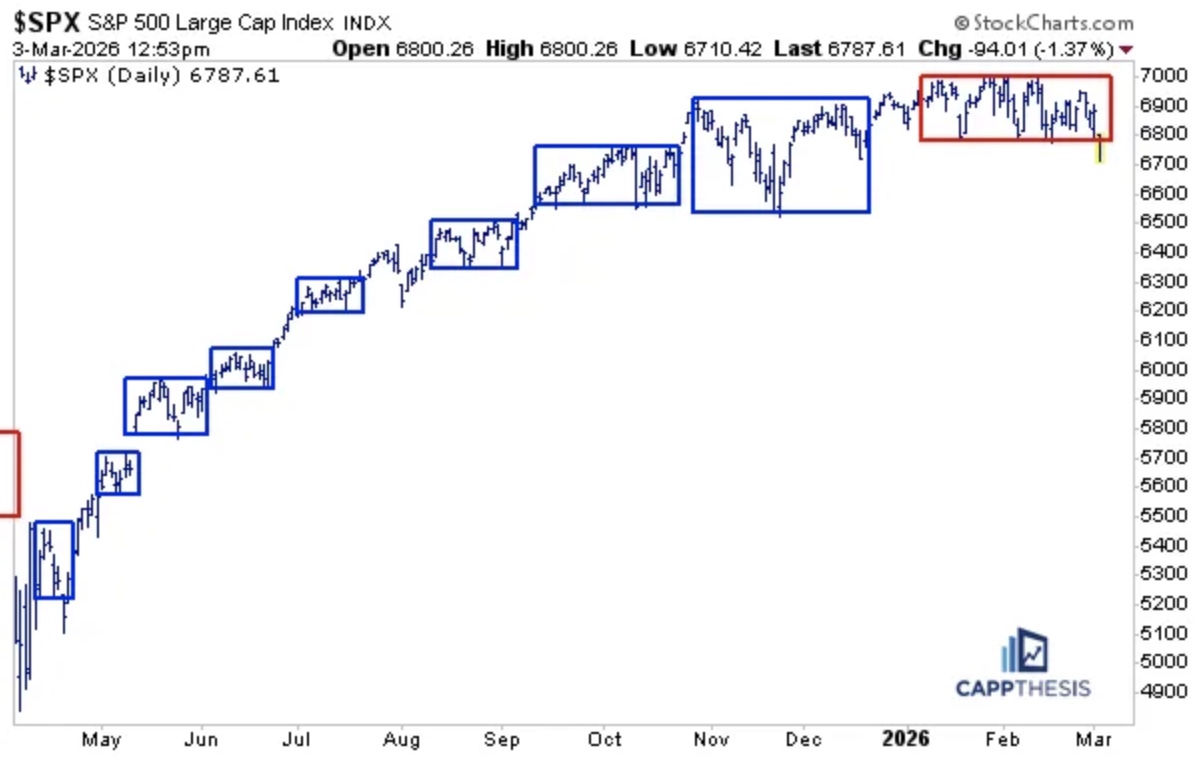
The S&P 500 is testing the lower bound of its recent trading range.
Read the complete breakdown from Frank Cappelleri.
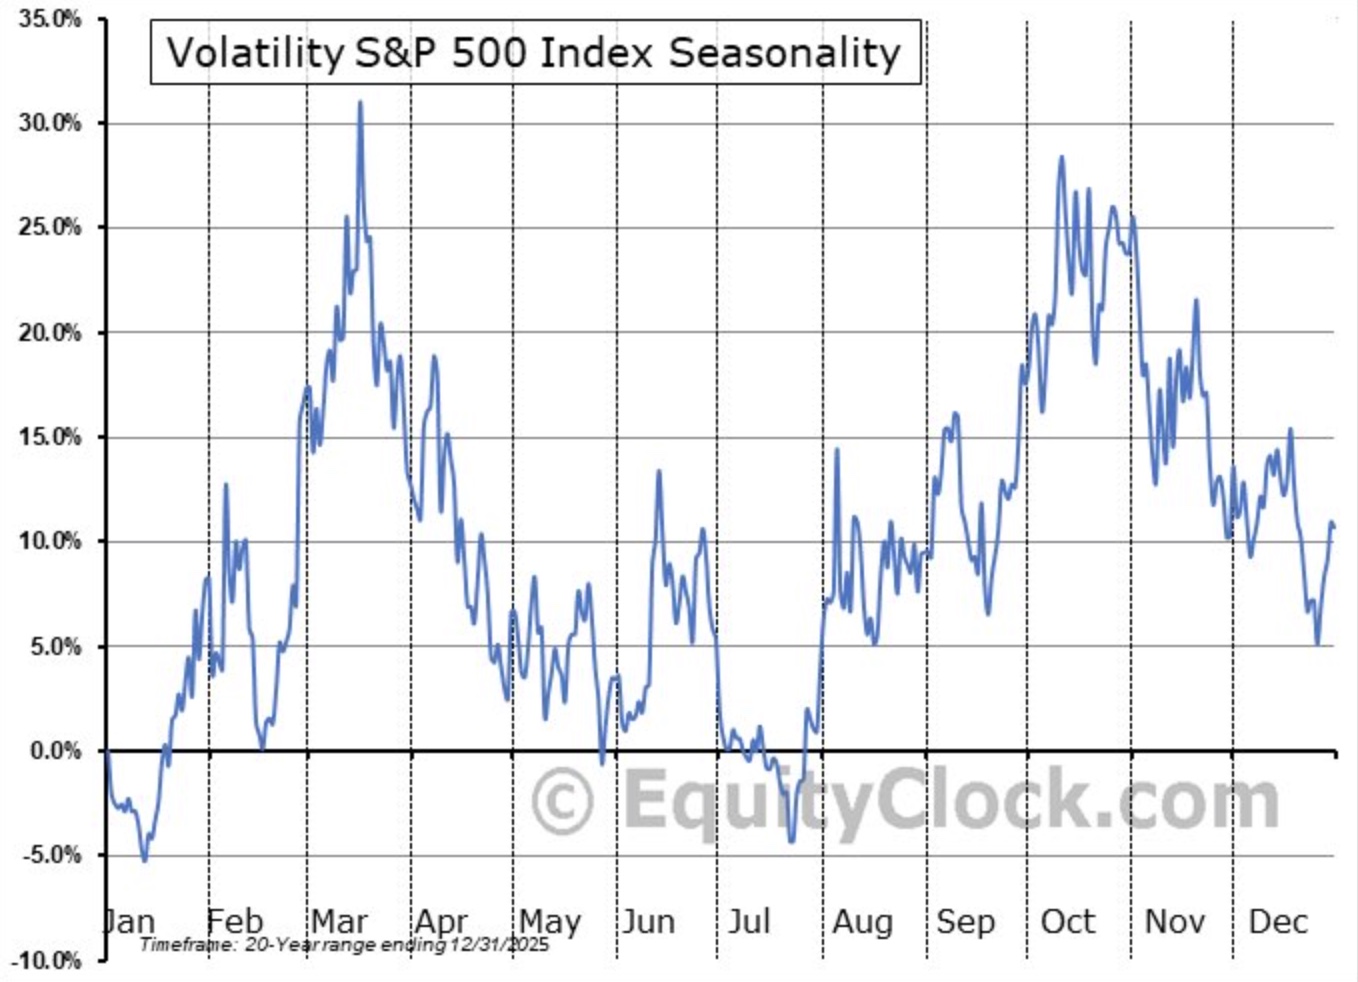
There's still a few more days of historically normal volatility, though the Iran conflict keep could volatility elevated deeper into March.
See whole tweet from Equity Clock.
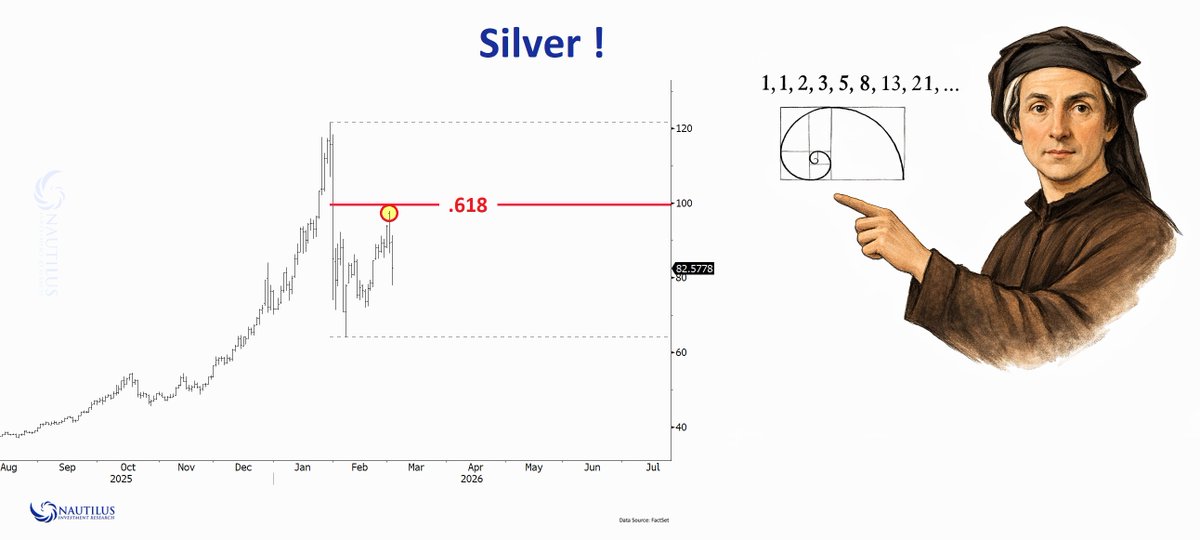
Silver is rolling over at the 61.8% Fibonacci retracement.
View the entire post from Nautilus Research.
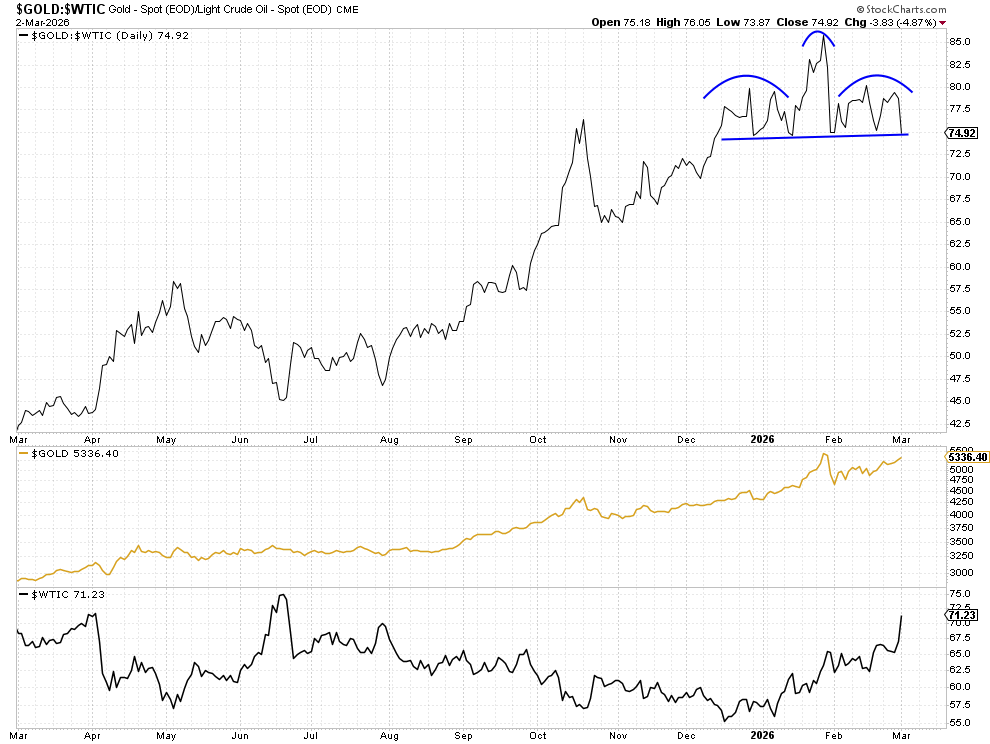
The Gold versus Crude Oil ratio has carved out a multi-week head and shoulders top.
Check out the latest note from Rotational Investing.
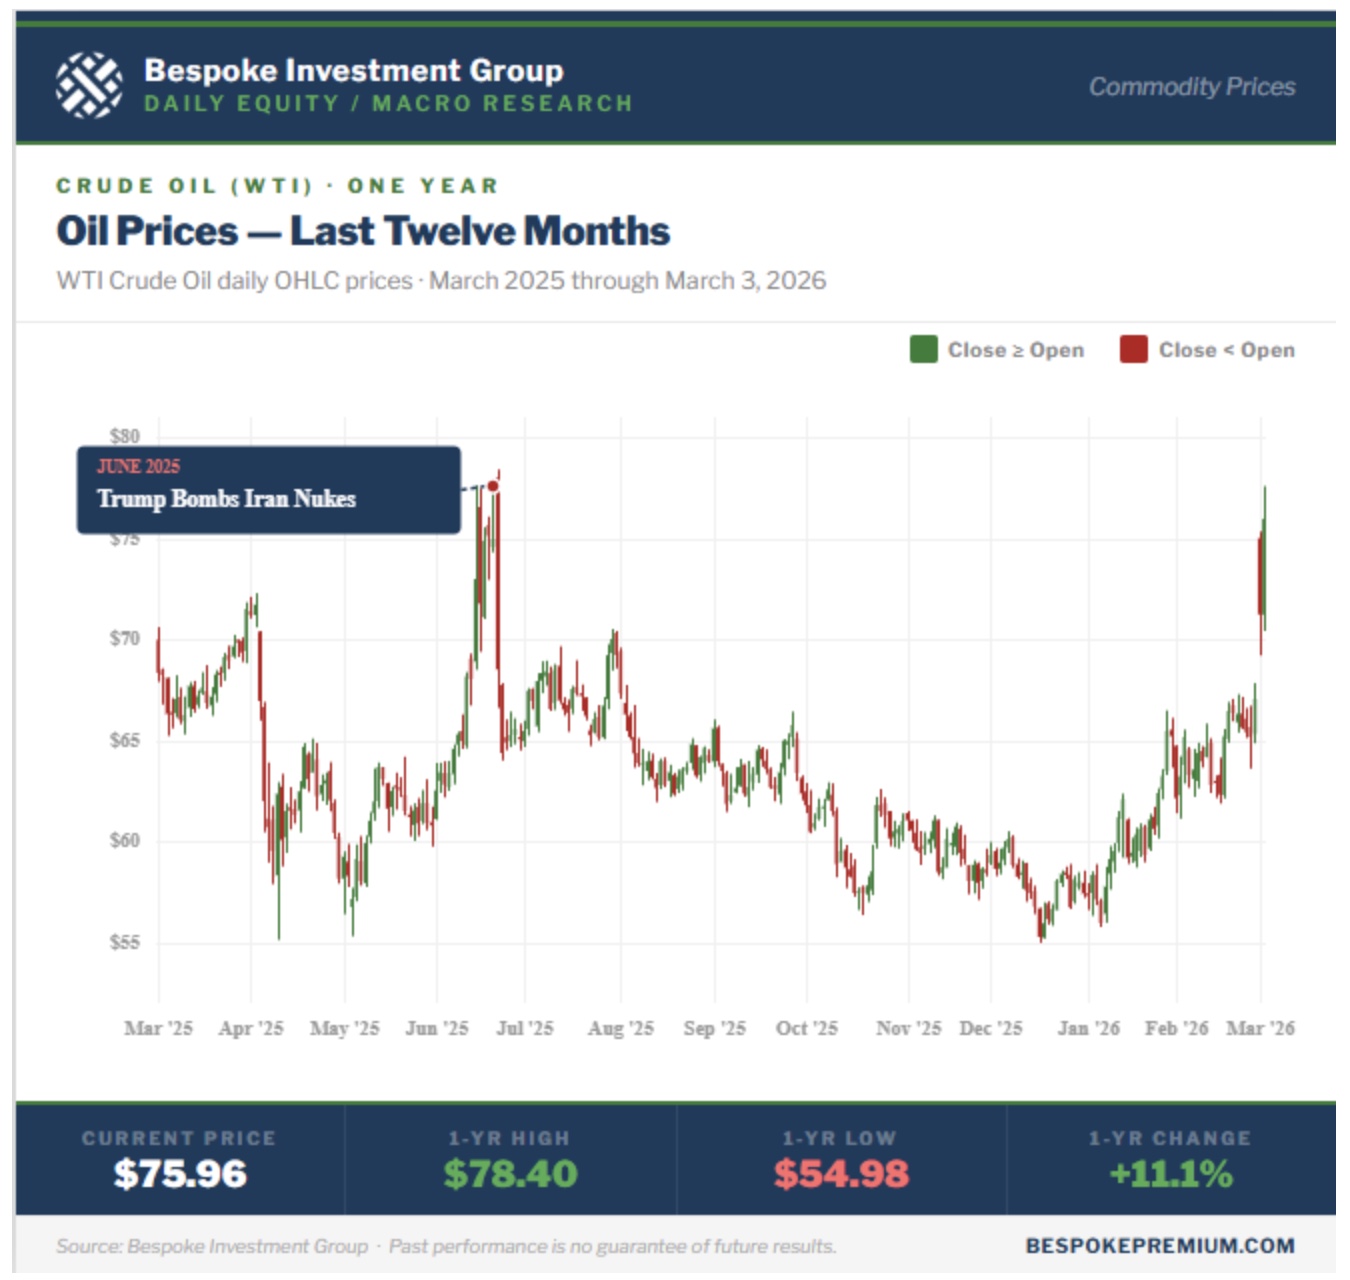
Oil prices are near the levels they peaked at last June when the U.S bombed Iran.
Access the full article from Bespoke.
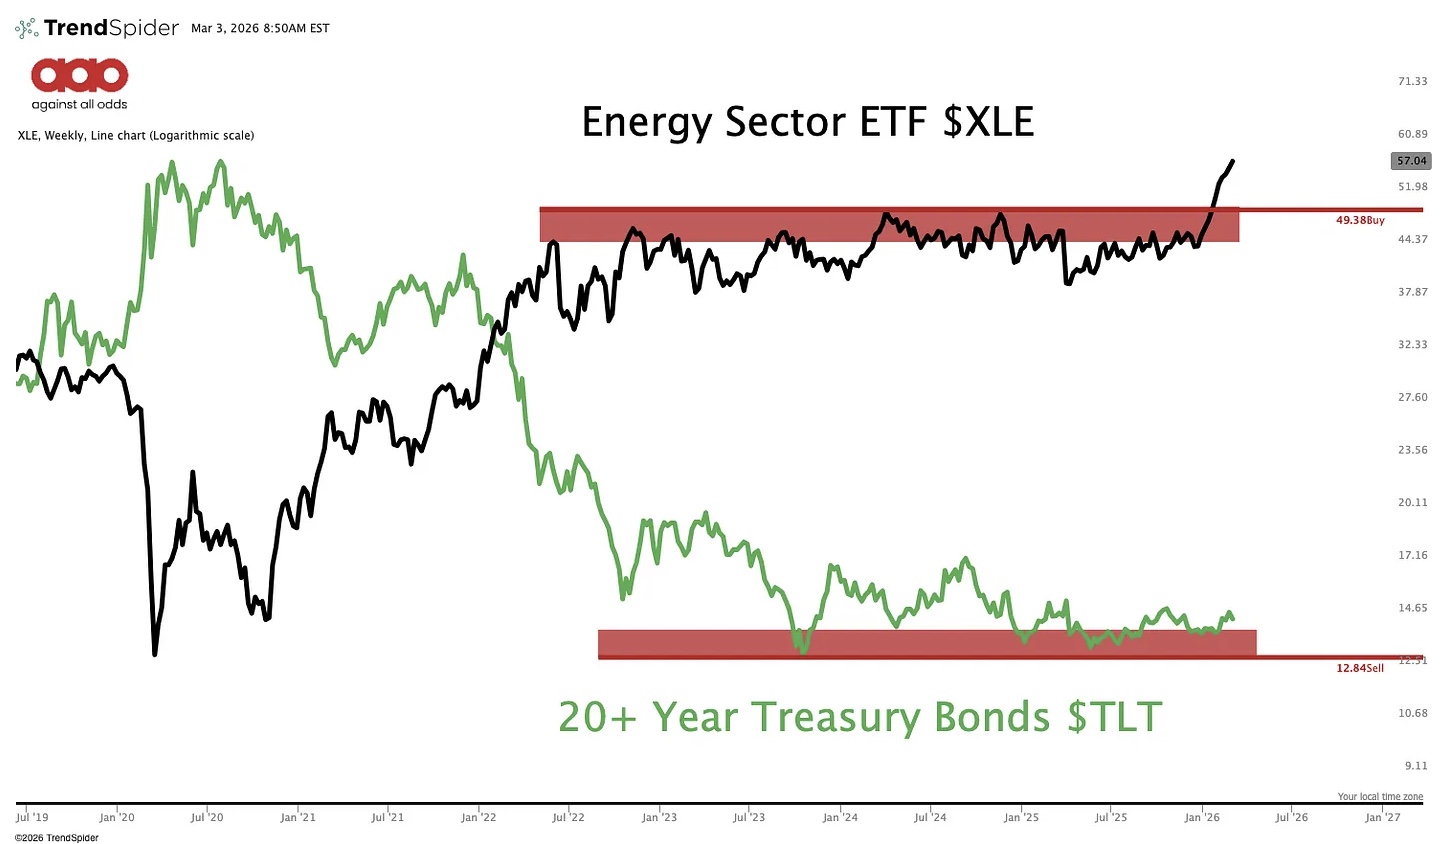
Energy and bonds tend to move in opposite directions.
With Energy breaking out, the question becomes whether bonds are next to break down.
Explore the newest commentary from Jason Perz.
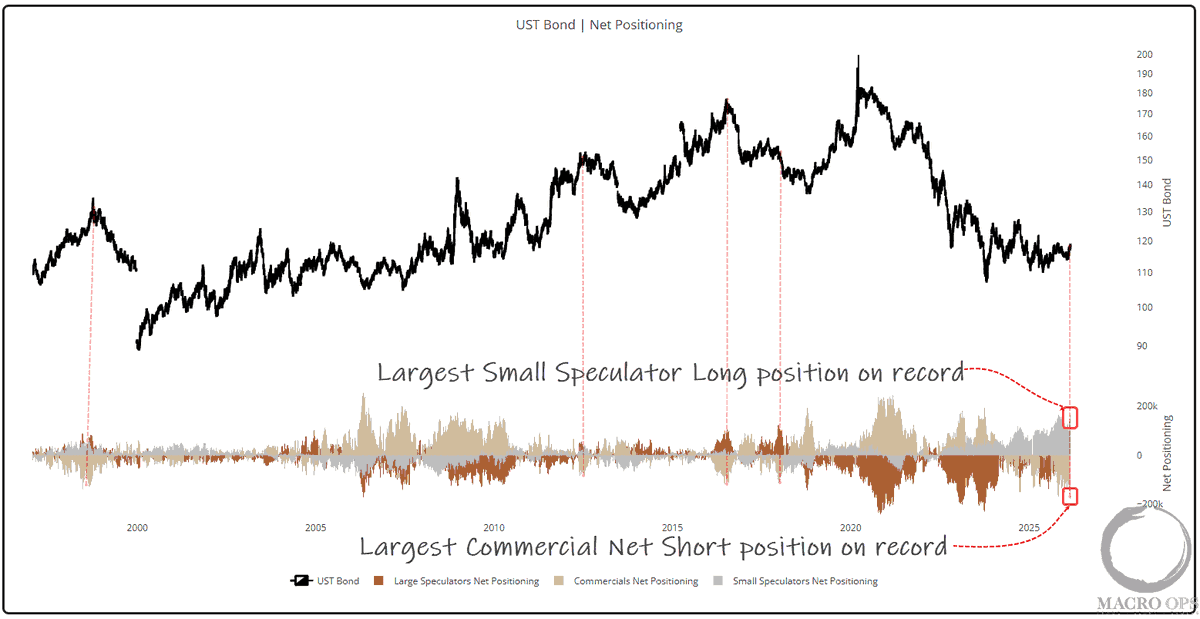
Small Speculator positioning in long bonds is at its highest level on record, while Commercials are holding record short exposure.
Read the full analysis from Alex Barrow.
The Chart Report curates best-in-class technical analysis from across the web.
If you’d like to share a chart or just say hello, email us at info@thechartreport.com