The Tanker Shipping Trade Keeps Sailing 📈 The Chart Report

Chart of the Day
🏆 Today's Chart of the Day was shared by Eric Balchunas.
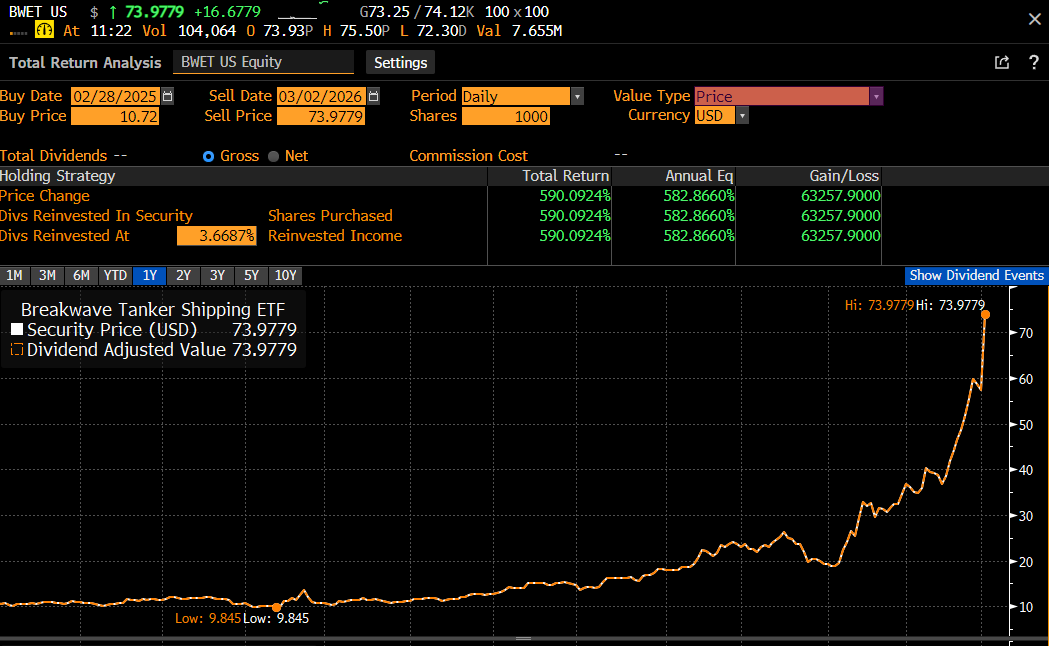
The Breakwave Tanker Shipping ETF ($BWET) closed at new all-time highs while posting its best single-day gain on record.
The ETF traded at record volume today and is now up +289% year-to-date and roughly +605% over the past year.
$BWET is a financial proxy for global crude shipping demand, and today’s action suggests tanker utilization remains elevated.
The Takeaway: Historic strength in tanker shipping continues as the ETF extends to new record highs.
More Great Charts
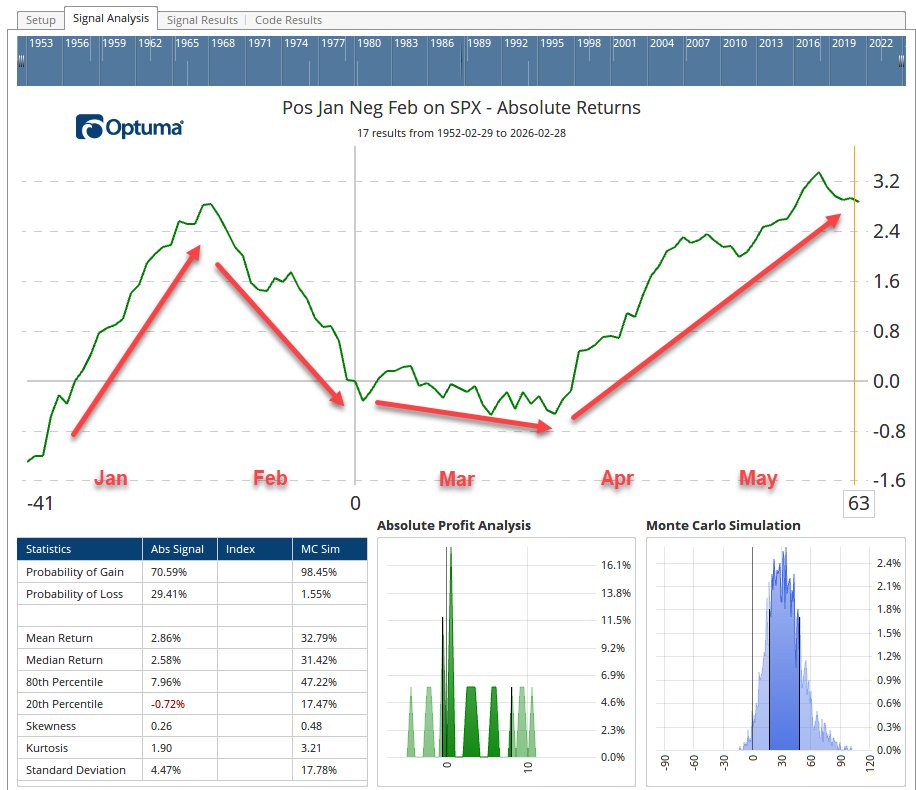
A positive January followed by a negative February has now occurred 18 times for the S&P 500.
Forward returns point to a choppy March, with a bottom being established toward the end of the month.
See the full tweet from Optuma.
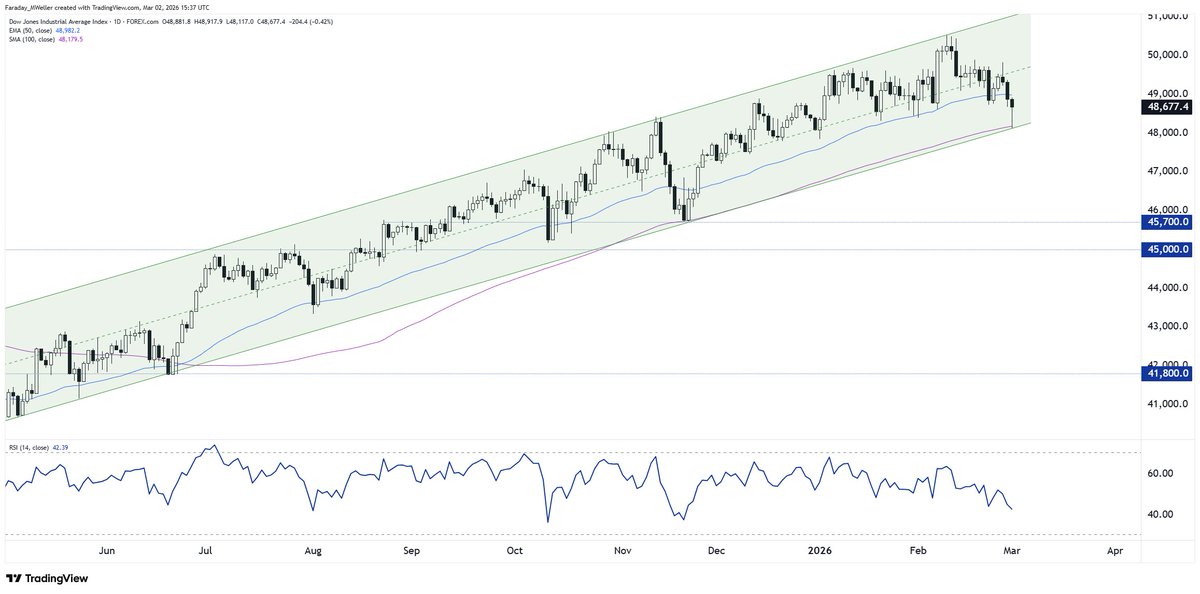
The Dow Jones Industrial Average found support at its rising 100-day moving average and the lower bound of its ascending channel.
View the entire post from Matt Weller.
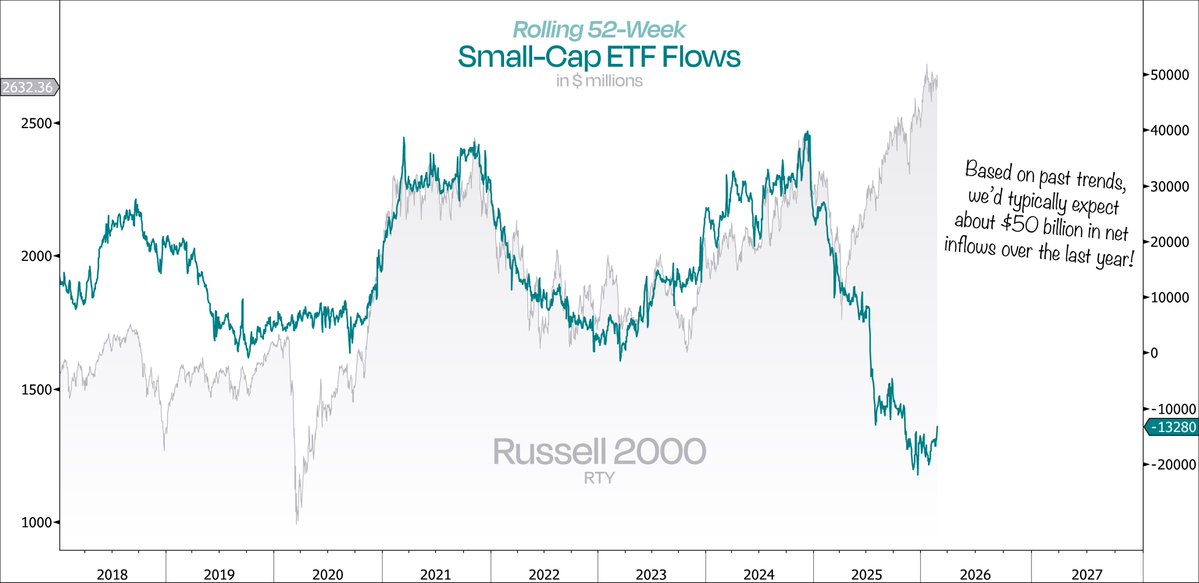
Looking at rolling one year inflows in Small-cap ETFs, there's a notable disconnect between performance and capital allocation.
Access the complete article from Duality Research.
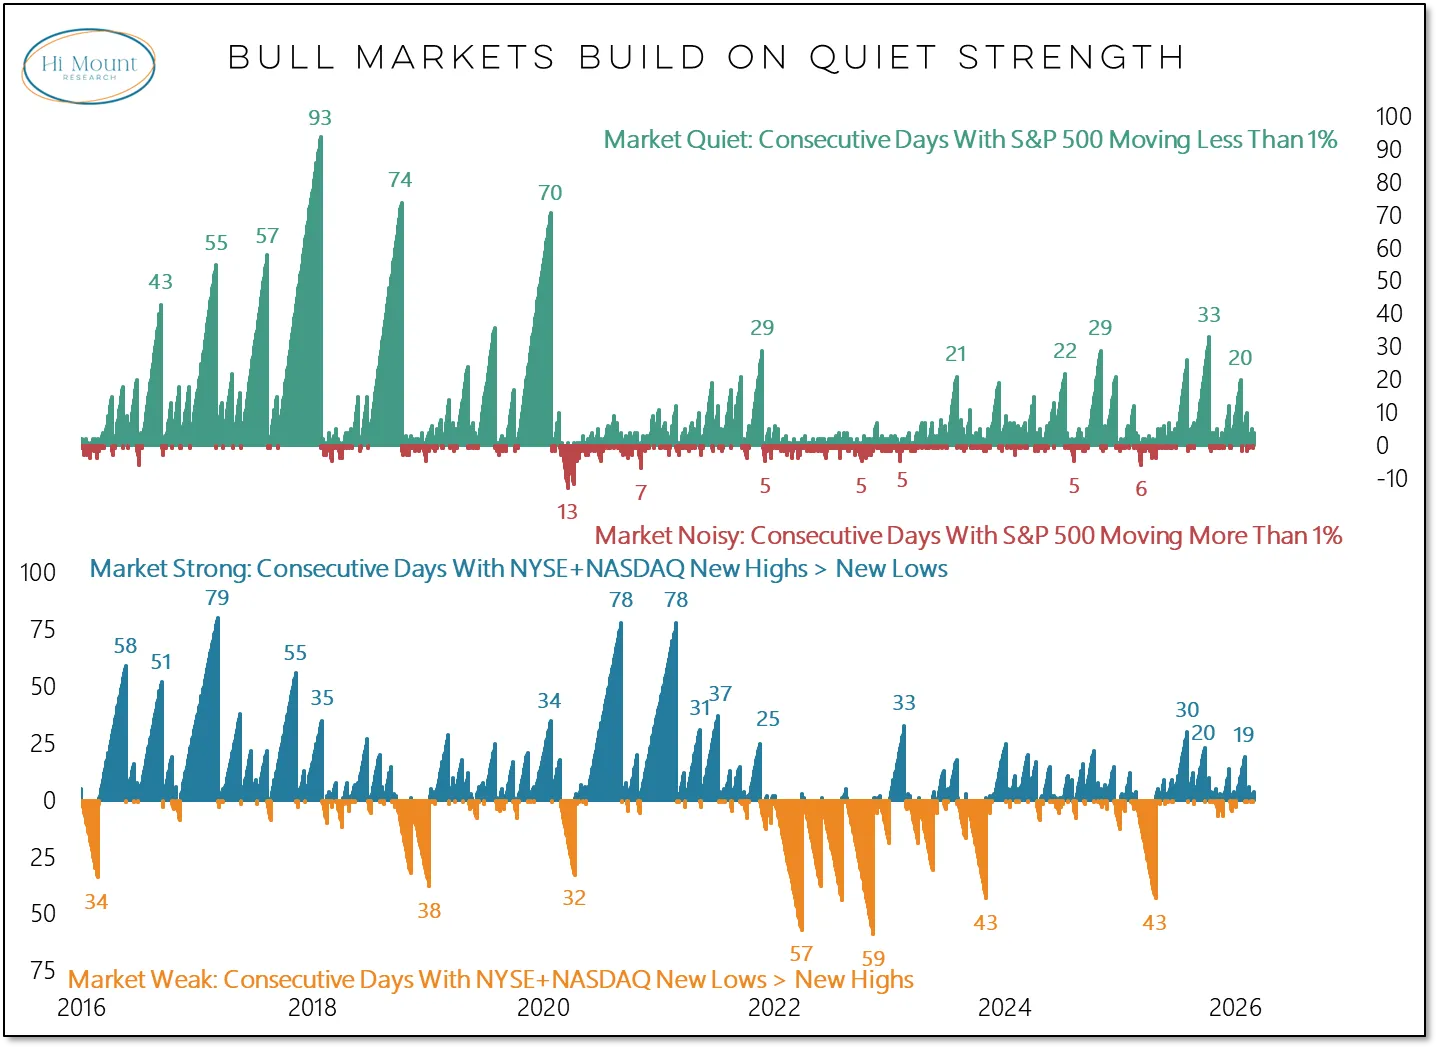
Bull markets build on quiet strength and low volatility.
Prolonged periods of sub -1% moves in the S&P 500 tend to align with sustained new highs versus new lows across the NYSE and Nasdaq.
Read the full analysis from Willie Delwiche.
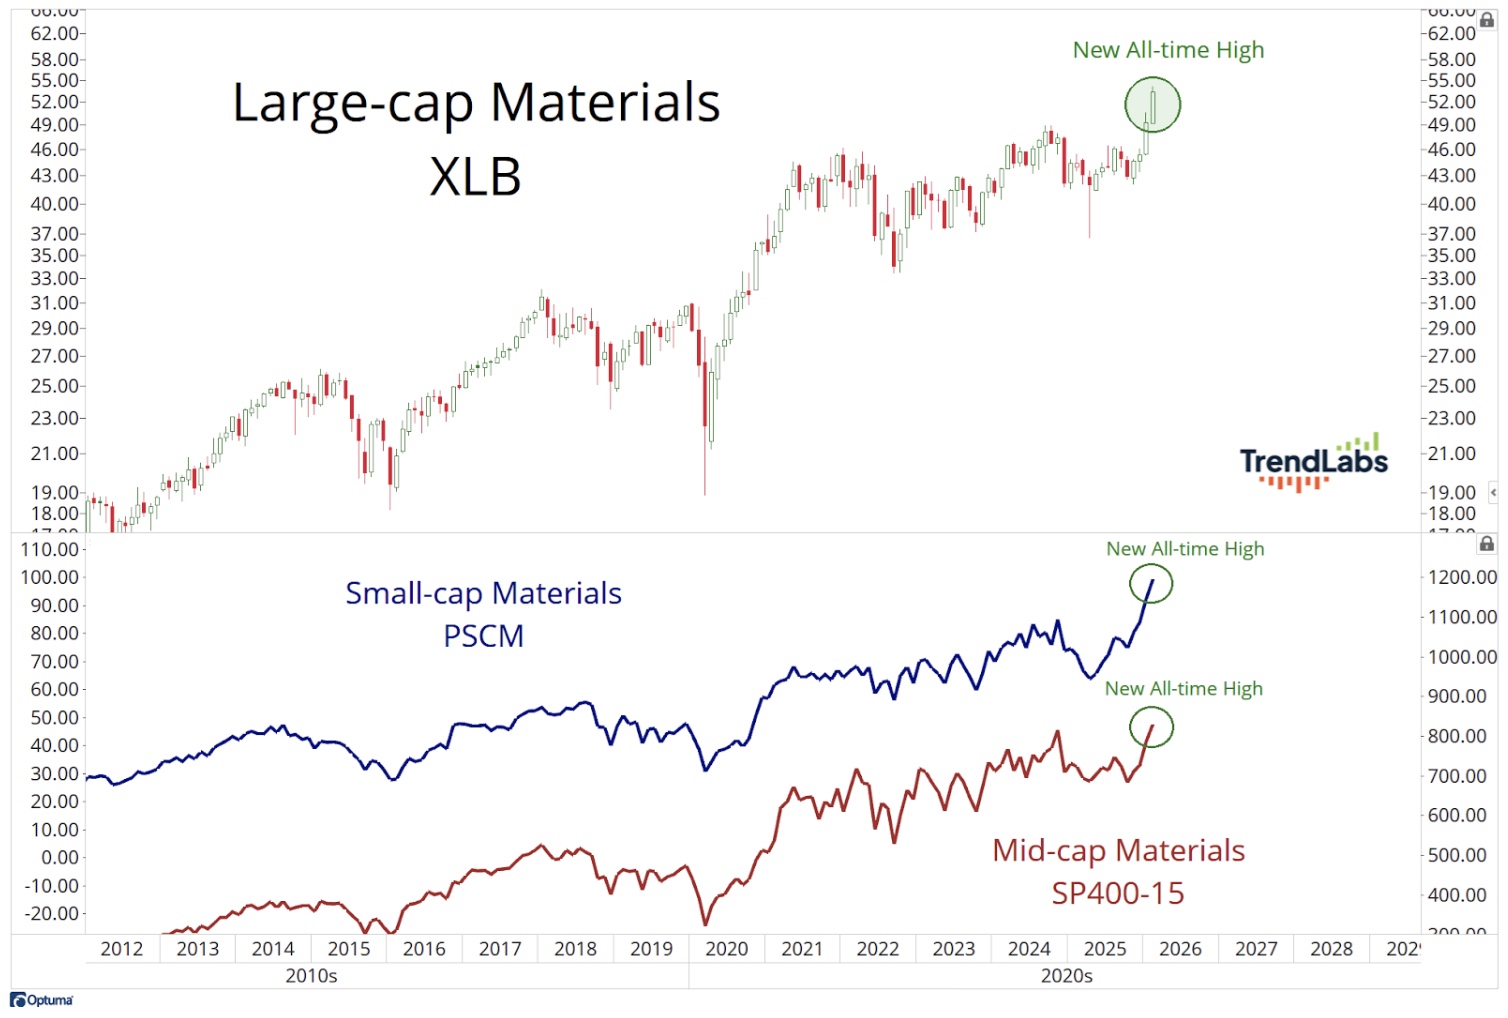
Materials strength has been broad-based this year, with large, mid, and small-cap materials all posting double-digit gains year-to-date.
Explore the latest note from JC Parets.
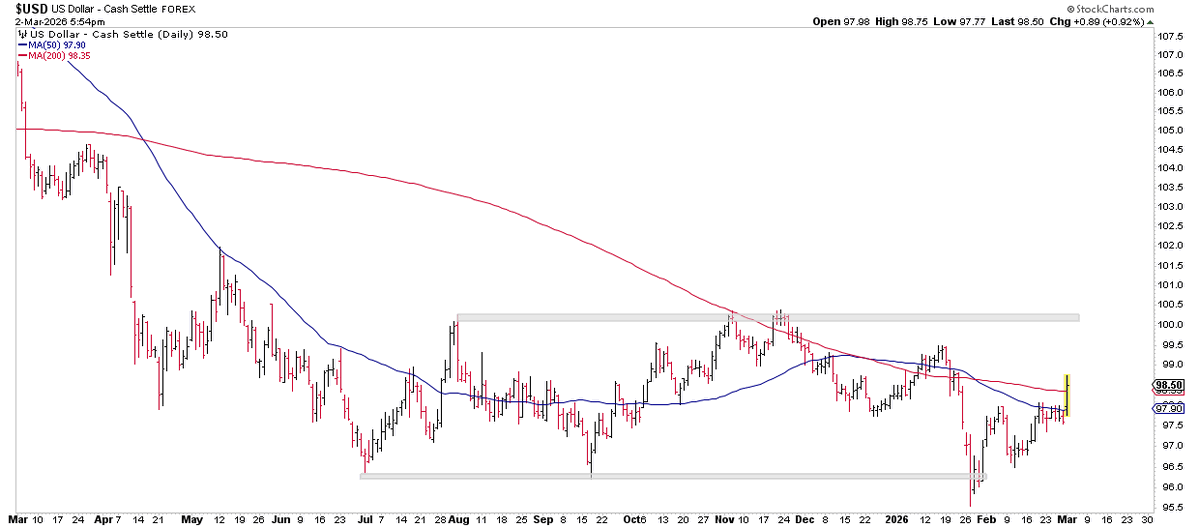
After a failed breakdown in the U.S. Dollar Index, $DXY has now reclaimed both its 50 and 200-day moving averages.
Check out the complete post from David Rath.
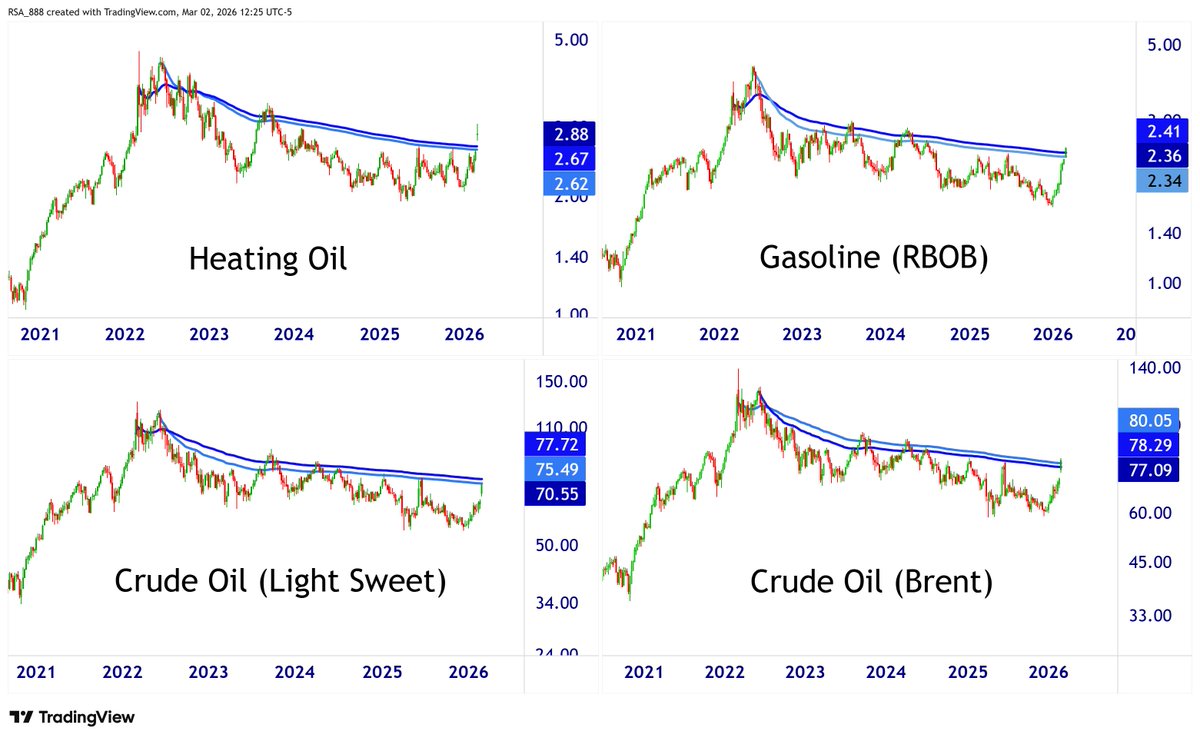
Heating Oil is the only major energy product trading above its 2022 AVWAP anchored highs, while the rest have found this level to be hard resistance.
View the whole tweet from Ricardo Sarraf.
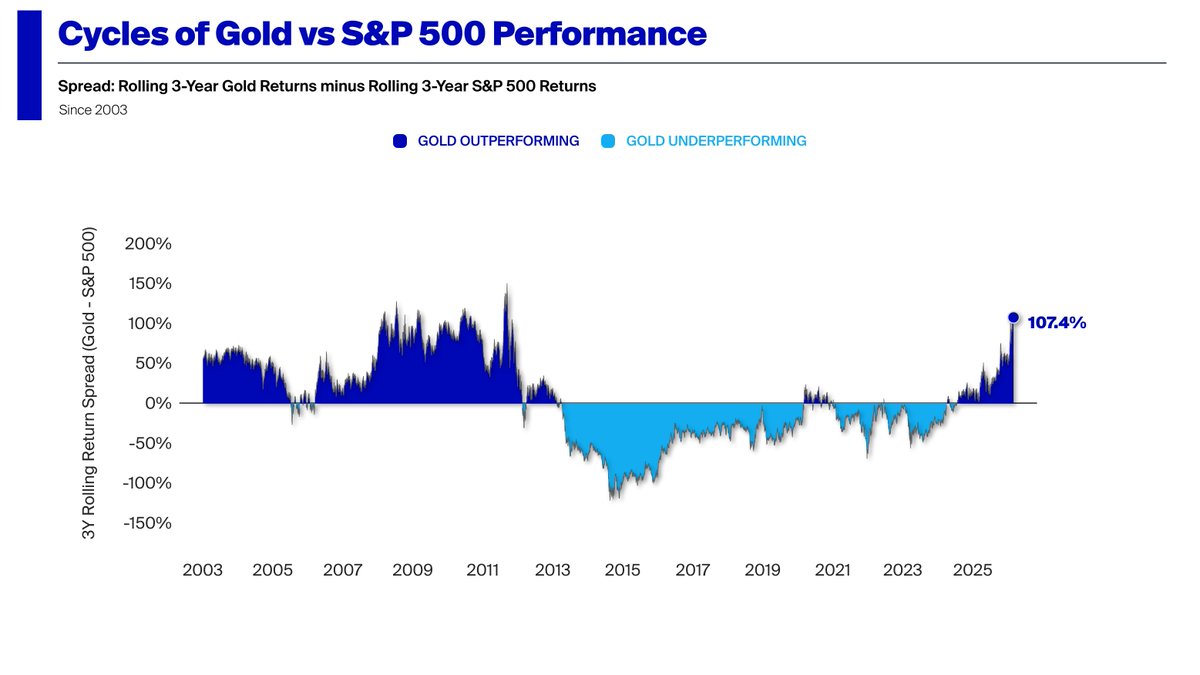
On a rolling three year basis, Gold is outperforming the S&P 500 by the widest margin since the period following the 2008 financial crisis.
See the entire post from Phil Rosen.
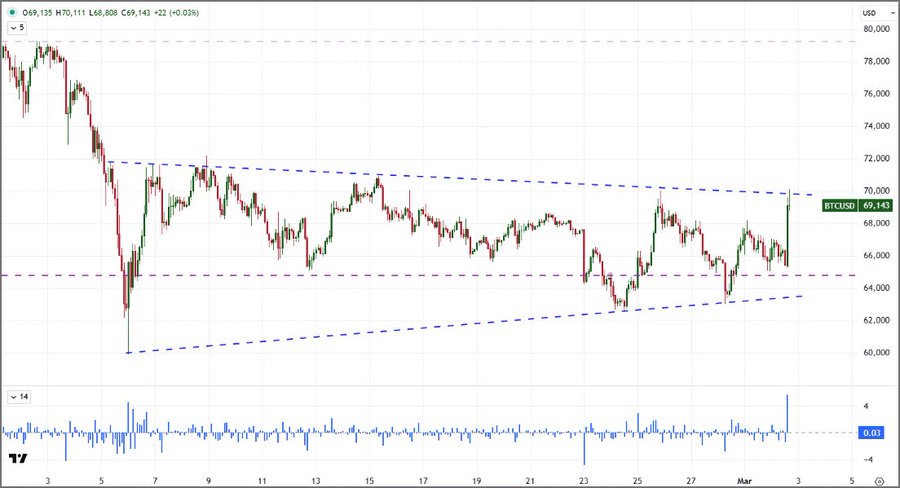
Following its best two hour rally since April 9 2025, Bitcoin is stalling at the top of this well defined wedge near $70,000.
Check out the full tweet from John Kicklighter.
The Chart Report curates best-in-class technical analysis from across the web.
If you’d like to share a chart or just say hello, email us at info@thechartreport.com