The Quiet Climb in Volatility 📈 The Chart Report

Chart of the Day
🏆 Today's Chart of the Day was shared by Jason Leavitt.
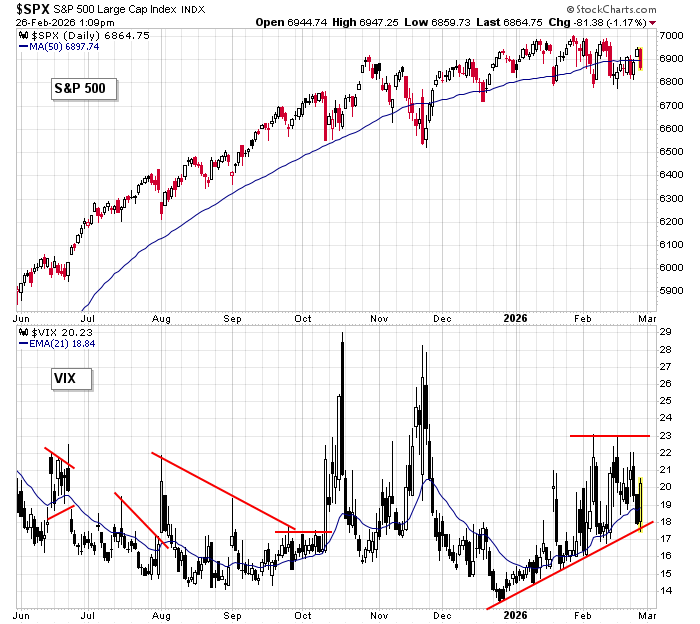
Since the start of the year, the Volatility Index (VIX) has formed a series of higher lows, with upside capped near 23.
This has coincided with a choppy market, as each burst of volatility has preceded sharp equity pullbacks.
Just two weeks ago, the VIX snapped its longest consecutive weekly advance since Covid, reinforcing the persistence of elevated volatility.
The Takeaway: The VIX continues to press higher, with a move above 23 increasing the downside risk for equities.
More Great Charts
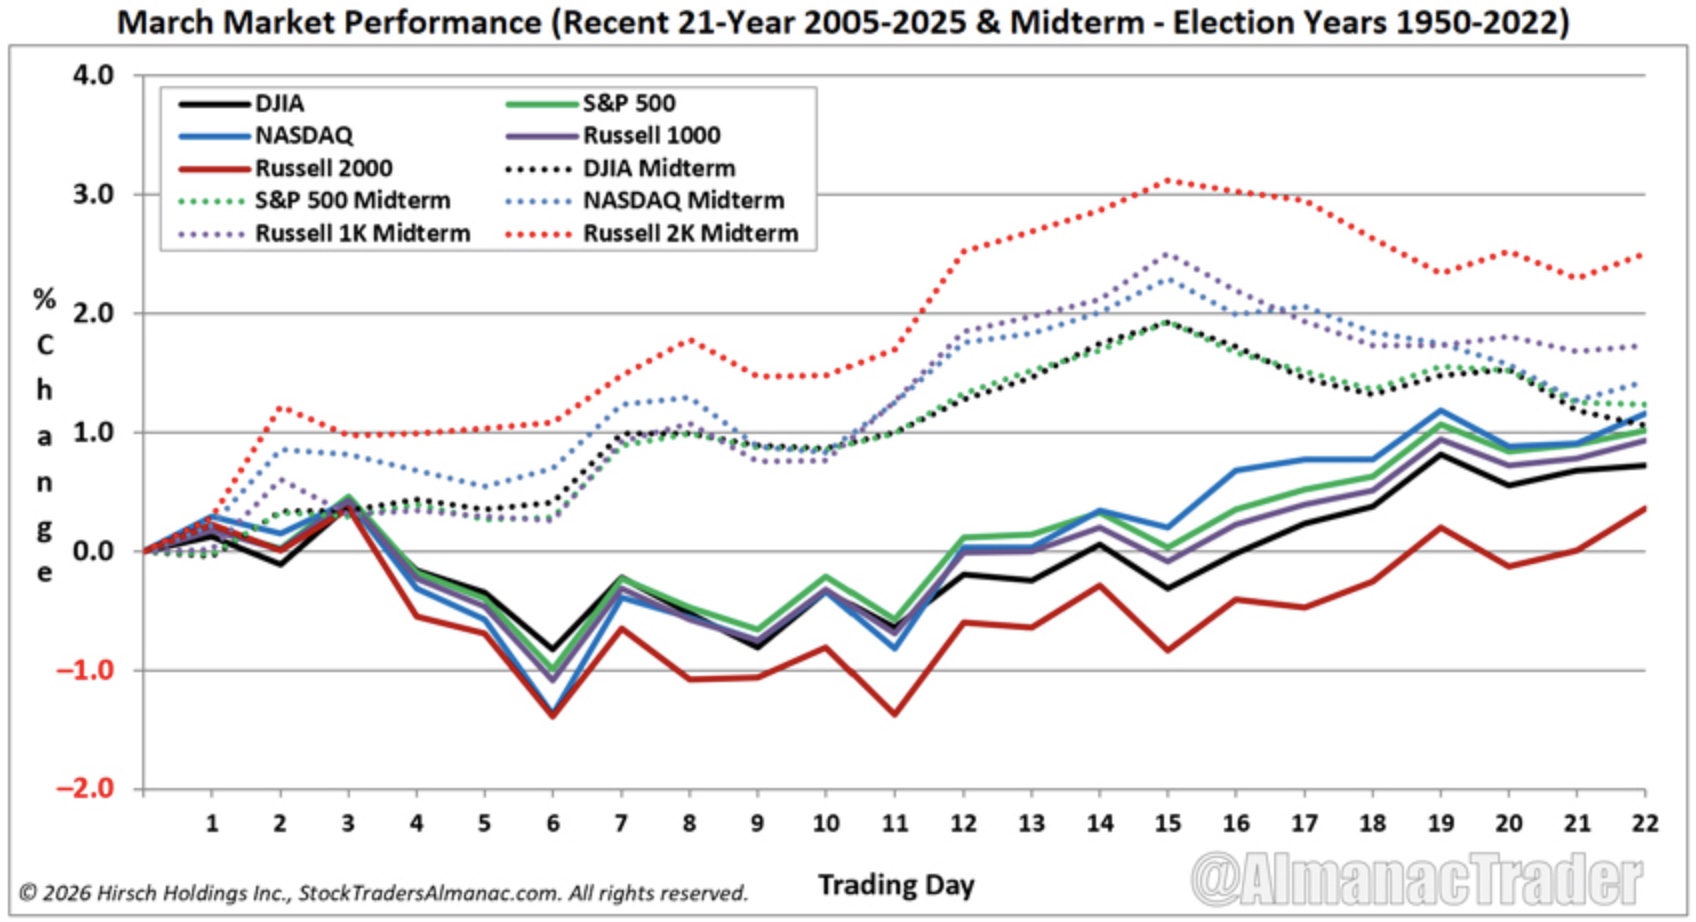
In midterm election years since 1950, March has typically started strong, with gains often extending into the first day of Spring.
Read the latest write-up from Jeff Hirsch.
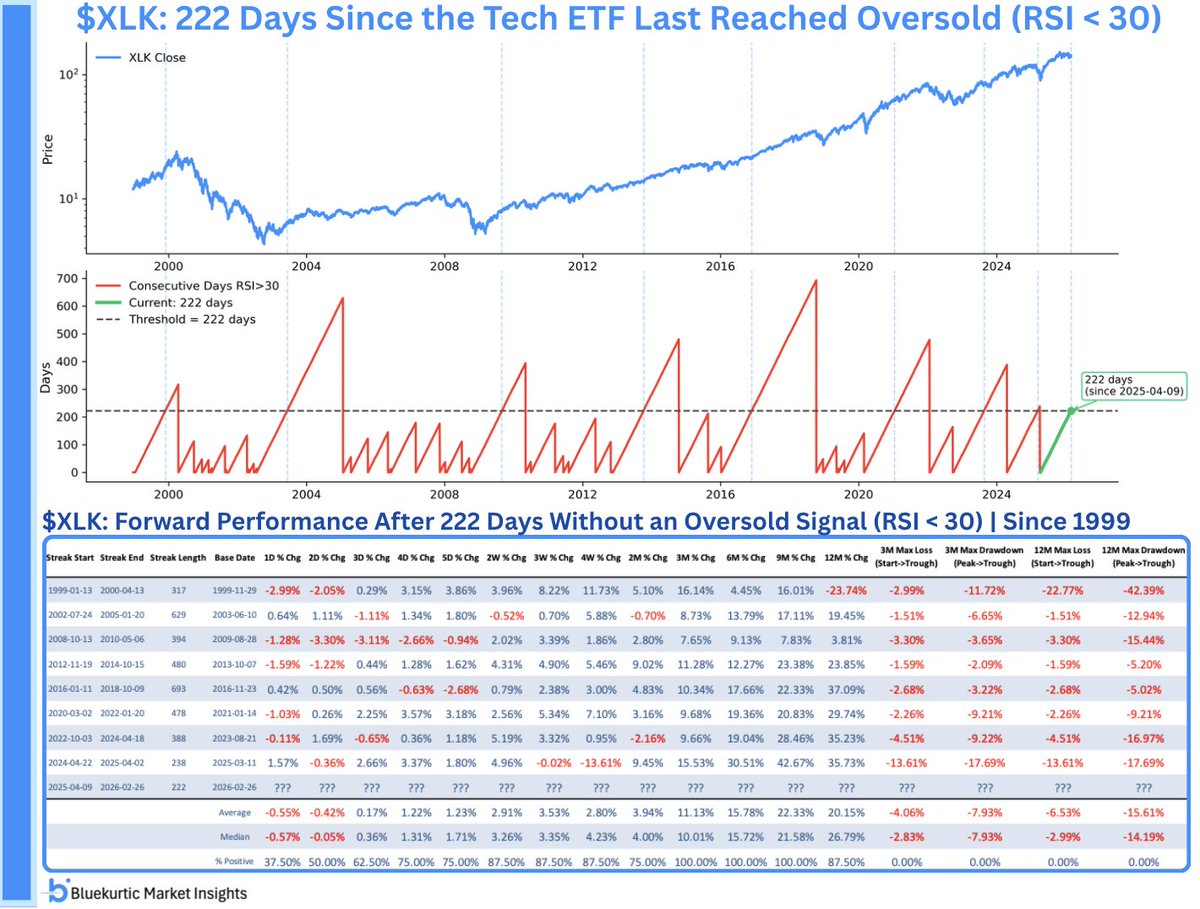
The Technology Sector hasn't been oversold in 222 days, its 8th longest streak since 1999.
See the full post from Bluekurtic Market Insights.
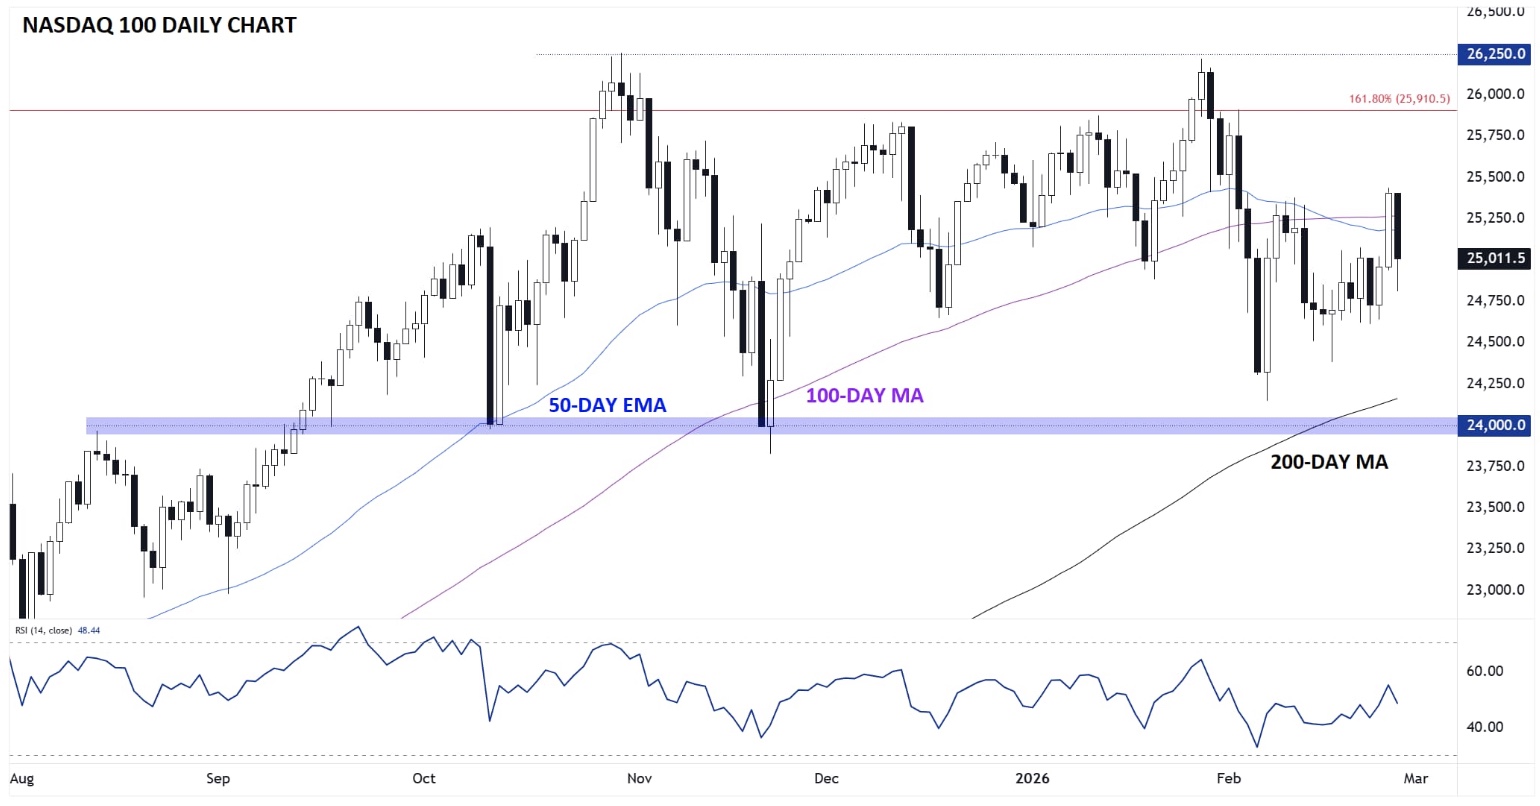
While the 50 and 100-day moving averages have flattened, the longer-term 200-day MA continues to slope higher.
Access the complete analysis from Matt Weller.
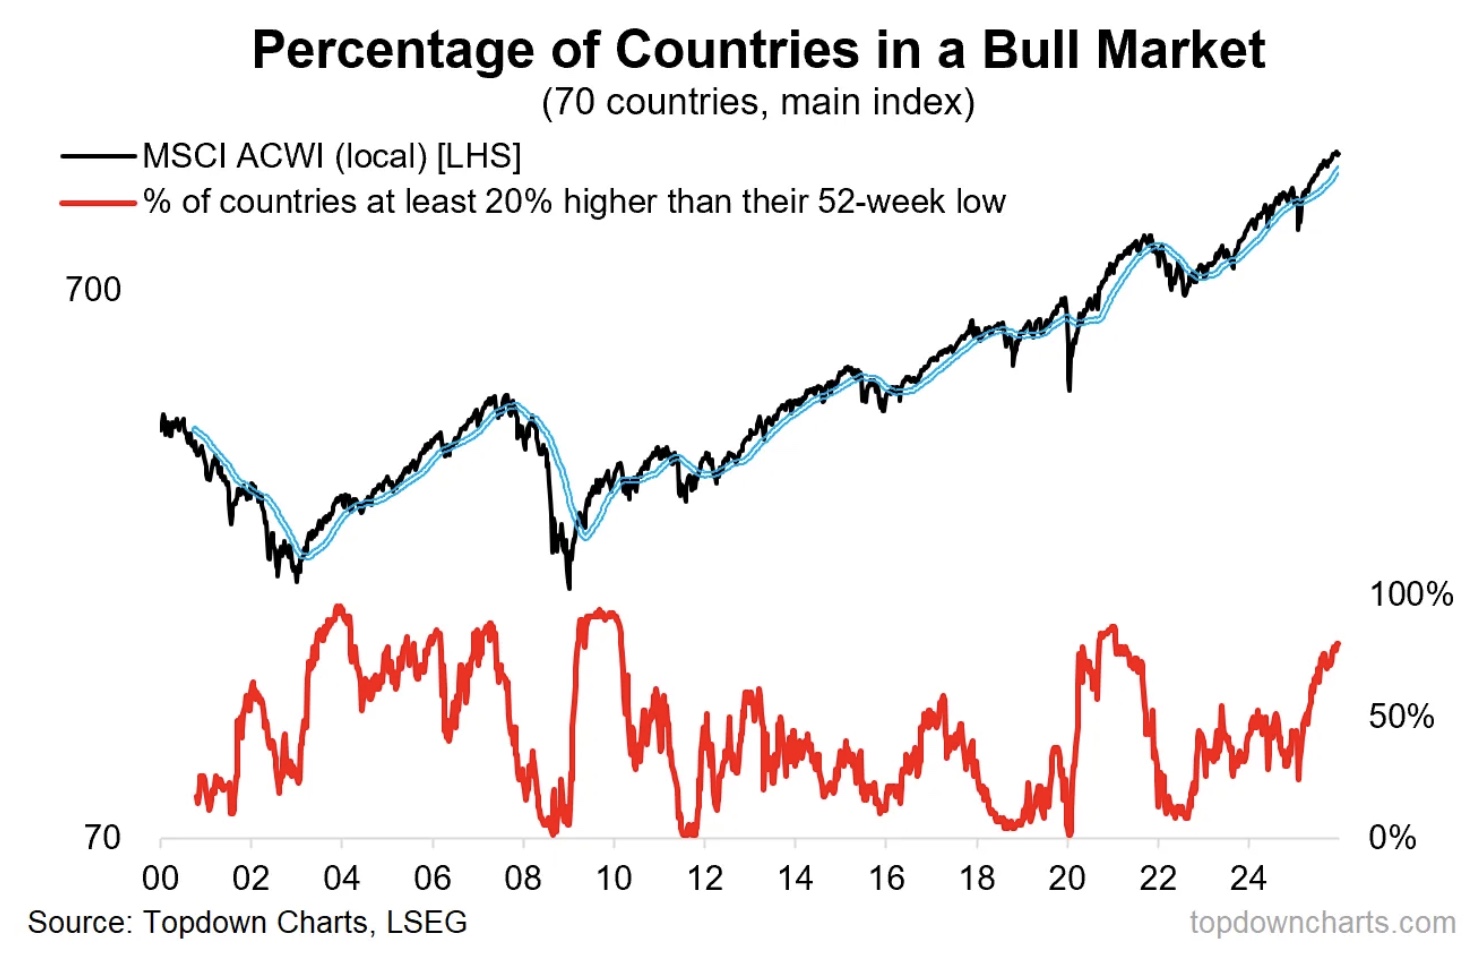
It's a global bull market, with 80% of countries up at least 20% off their 52-week low.
Check out the newest article from Topdown Charts.
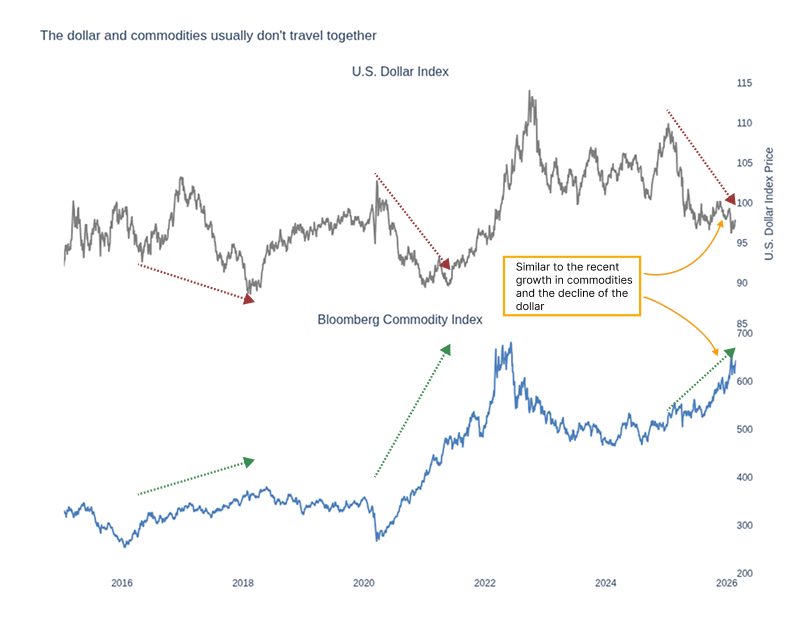
The inverse relationship between the U.S. dollar and commodities remains firmly intact.
View the full tweet from Sentiment Trader.
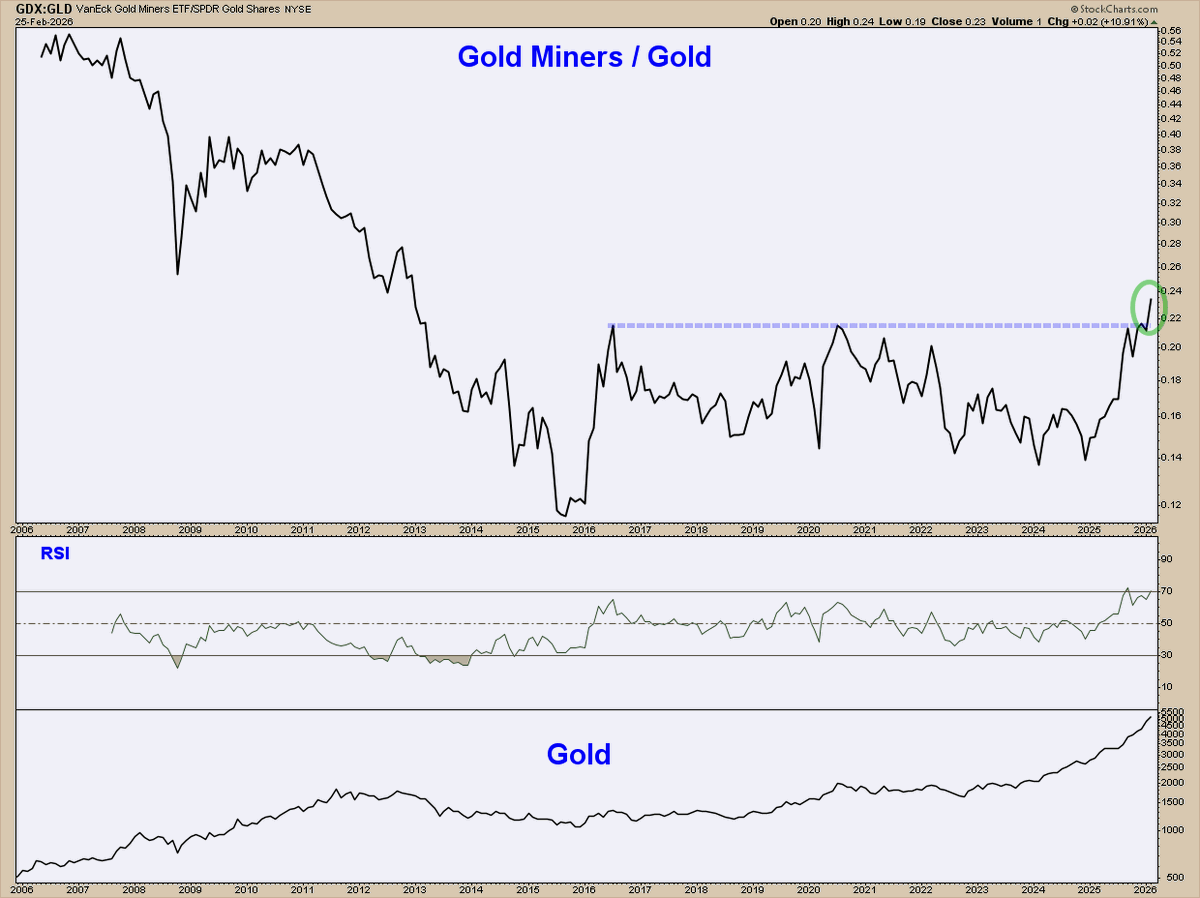
Gold miners are making new multi-year highs relative to Gold.
See the complete post from Jim Knarr.
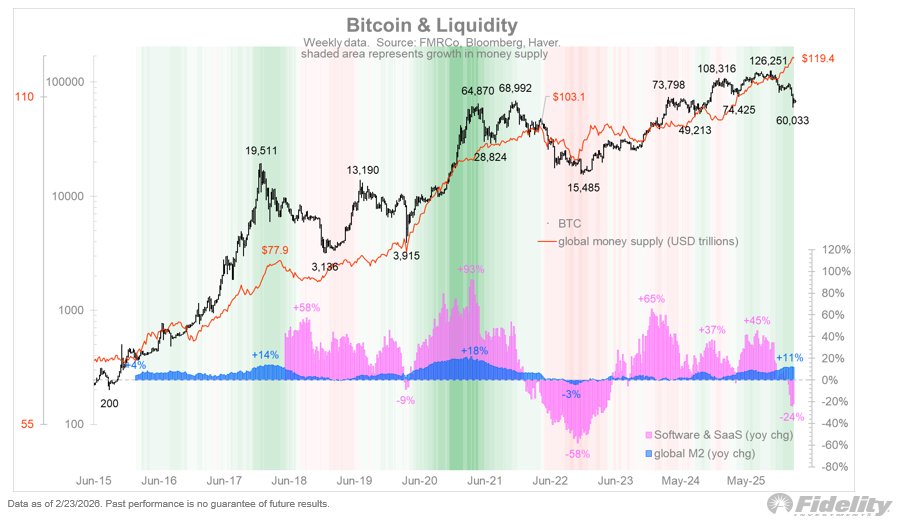
We're seeing a significant divergence between Bitcoin and the global money supply.
Explore the detailed take from Jurrien Timmer.
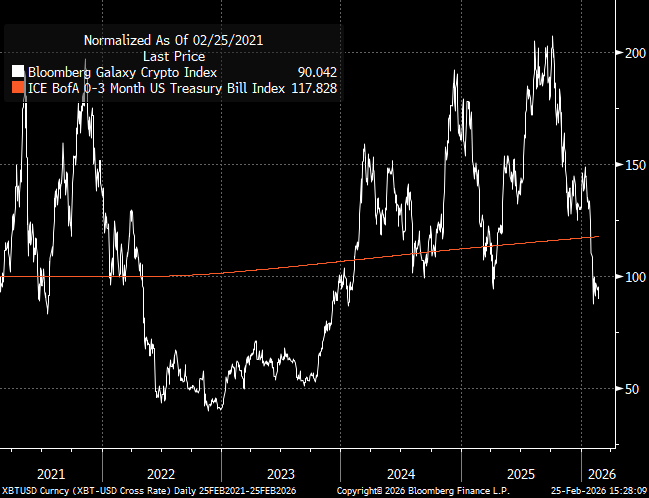
Over the past five years, being in cash has outperformed holding crypto.
Check out the humorous tweet from RBAdvisors.
The Chart Report curates best-in-class technical analysis from across the web.
If you’d like to share a chart or just say hello, email us at [email protected]